Ground Access Times and Revisits
In this section, the constellation design tools, specifically for Earth coverage and ground station revisit time computations will be shown.
Performing Ground Coverage analysis
This example scenario is available in example_compute_fleet_coverage.py. Here, a constellation design process stage is emulated, comparing two distinct constellation parameters in terms of key performance indicators.
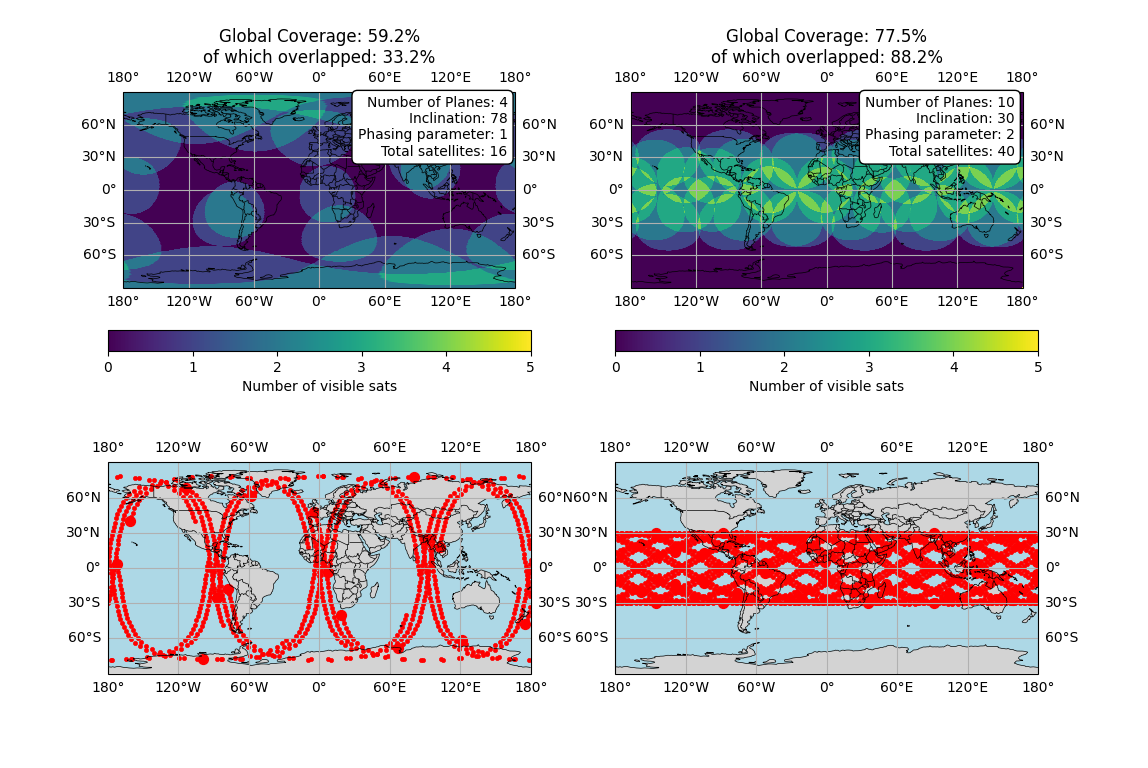
Specifically, two constellations are compared in terms of:
- Global coverarage and visibility overlap
- Distinct ground station revisit times
- Ground station access times.
After configuring the analysis run-time, utilized time-step and desired MDS exports, the output coverage and statistics files are generated and stored in \Export\FleetDataExportCSV\ directory.
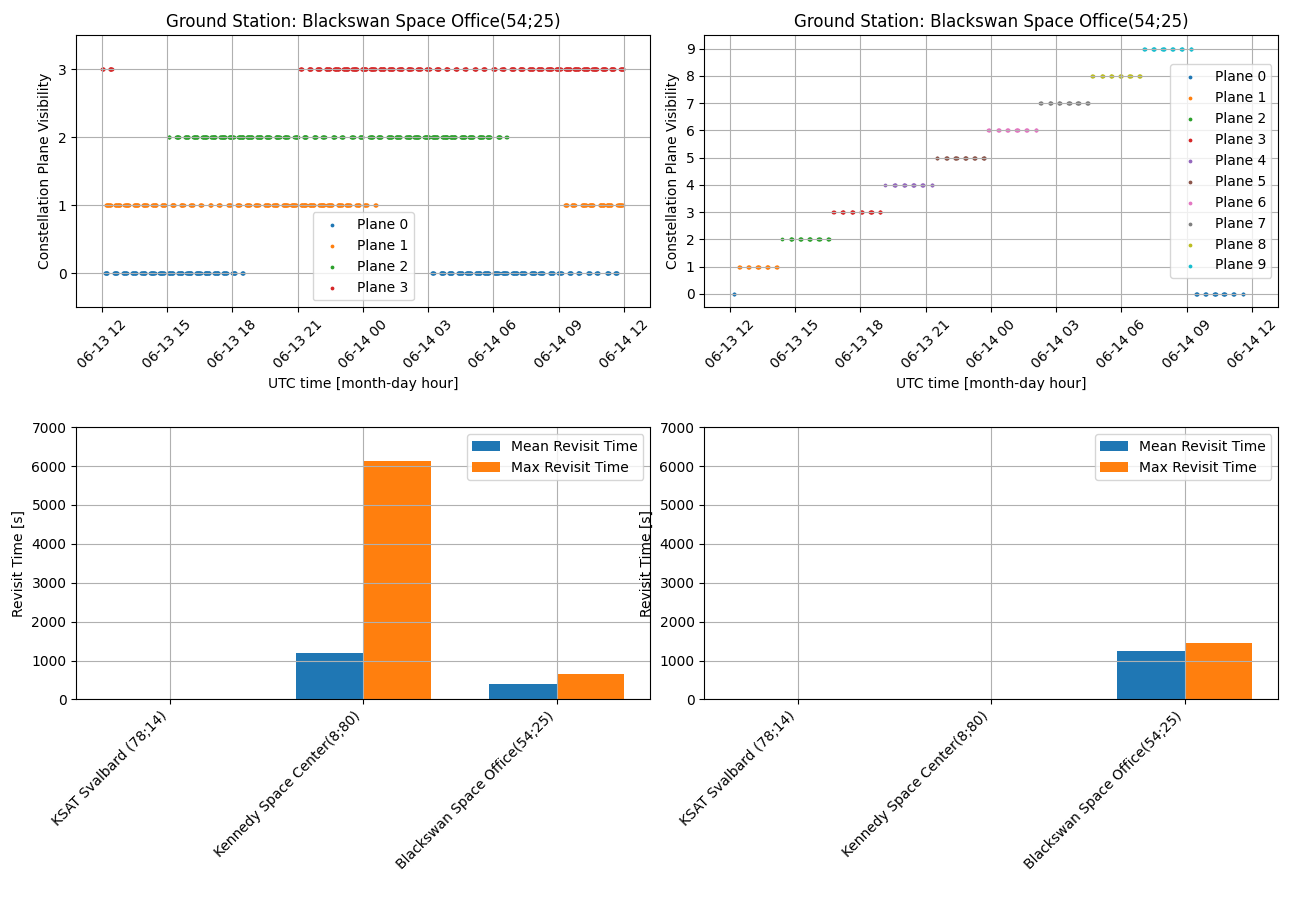
In the example script, the outputs are automatically loaded, proccessed and plotted. The output plots can be readily used for analyses:
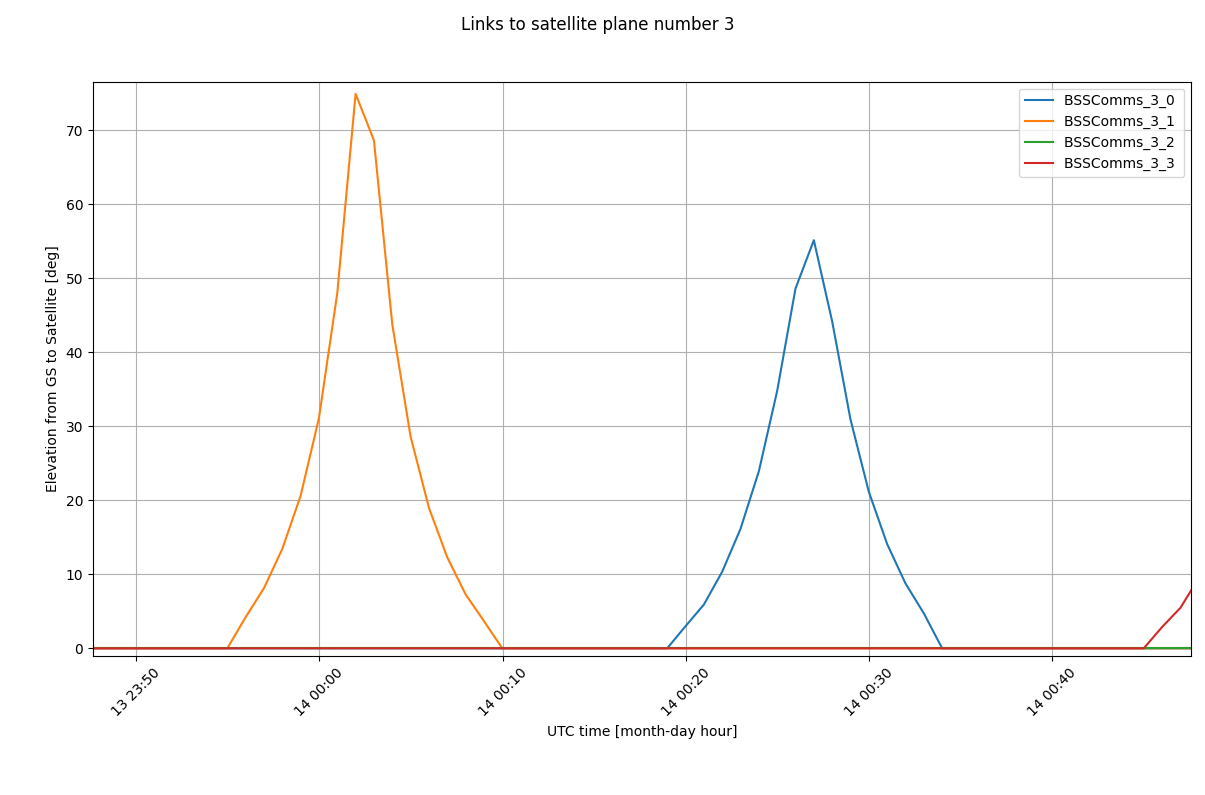
Another direct output are the access times for any loaded Ground Station. These could readily be used to plan ground downlinks.
Finally, statistical calculations are done, providing the mean, max, minimum revisit times to ground stations of interest: