Power Subsystem
This section outlines how to configure and use the power subsystem components for spacecraft within MDS. The power subsystem allows for the simulation of power generation (via solar panels), energy storage (via batteries), and power consumption. This is all well integrated with satellite attitudes, eclipses.
How to use the Power Subsystem?
To utilize the power subsystem, you must configure the components on a per-satellite basis. This involves three main steps:
- Generation: Defining solar panels with their physical and electrical properties.
- Storage: Configuring secondary battery capacity and charging parameters.
- Consumption: Setting the baseline power usage of the spacecraft.
These functions should be called after the satellite has been added to the scene using
mds_api.add_sat().Each satellite can have multiple number of solar panels and batteries.
The following functions are available for configuring the power subsystem.
1. Add Solar Panel
Attaches a solar panel to the spacecraft to enable power generation based on solar flux and orientation.
mds_api.add_solar_panel(
    sat_name: str,
    position: list[float],
    rotation: list[float],
    area: float,
    max_power: float,
    efficiency: float,
    display_axis: bool = True
)
Parameters:
sat_name(str): Name of the spacecraft to which the panel shall be added.position(list): Local position vector of the solar panel's center relative to the spacecraft body frame origin [m].rotation(list): Local rotation quaternion of the solar panel relative to the spacecraft body z-axis.area(float): Surface area of the solar panel [m²].max_power(float): Maximum power output the panel can generate [W].efficiency(float): Efficiency of the solar cells (0.0 to 1.0) [-].display_axis(bool, optional): Flag to toggle the visual aid axis. Defaults toTrue.
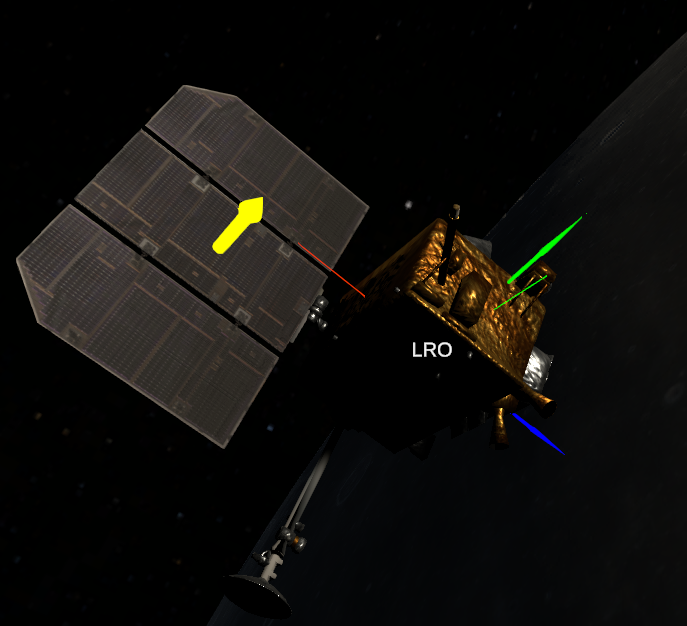
To make it easier to set the correct location and rotation of the solar panel, you can set
display_axistoTrueto have a normal vector. Make sure that this vector is in the center of solar array and is perpendicular to surface of array.
2. Add Battery
Configures the energy storage system for the spacecraft.
mds_api.add_battery(
    sat_name: str,
    charger_efficiency: float,
    battery_capacity: float,
    charge_fraction: float
)
Parameters:
sat_name(str): Name of the spacecraft.charger_efficiency(float): Efficiency of the battery charging process (e.g., 0.95 for 95%).battery_capacity(float): Maximum energy storage capacity of the battery [Wh].charge_fraction(float): Initial state of charge as a fraction of max capacity (0.0 to 1.0).
3. Set Power Consumption
Sets the baseline power draw of the spacecraft. You can actively control this to emulate different operational modes and their power consumption.
mds_api.set_power_consumption(
    sat_name: str,
    power_consumption: float
)
Parameters:
sat_name(str): Name of the spacecraft.power_consumption(float): Total power consumption of the spacecraft [W].
Getting data from MDS
To obtain data about satellites power subsystem you need to use mds_api.get_sat_data():
try:
    _, sat_data = mds_api.get_sat_data(sat_name)
    panel_data = sat_data["spacecraftData"]["solarPanels"][0]
    batteries_data = sat_data["spacecraftData"]["batteries"][0]
except (KeyError, json.decoder.JSONDecodeError):
    print("Error while getting satellite data")
try:andexecpt:statements are only necessary whenmds_api.get_sat_data()is called multiply times in quick succession in a loop. See:example_lunar_orbiter.py.
[0]insat_data["spacecraftData"]["solarPanels"][0]is an id number of solar array. Change it to get data from other solar panels (if they exist).
After that data could be accessed directly: batteries_data["<data_name_batt>"] for battery and panel_data["<data_name_panel>"] for solar panel.
Replace <data_name_batt> and <data_name_panel> with the desired parameter. The full list of parameters is provided below.
<data_name_batt>batteryWattHoursDelta- change from last battery charge stepcapacityWattHours- total battery capacity [Wh]chargeFloat- current battery charge level (0.0 - 1.0)chargeWattHours- current battery charge [Wh]chargerEfficiency- set battery charging efficiency (0.0 - 1.0)<data_name_panel>area- area of solar array [m2]displayAxis- show visual aid axis (TrueorFalse)lightAmmountReceived- solar flux received by satellites solar panels [W]maxPower- max power that solar array can generate [W]powerEfficiency- power efficiency of solar array (0.0 - 1.0)powerGenerated- current generated power [W]
For more information about reading data see:
example_comm_power_manager.pyorexample_lunar_orbiter.py.
Example Usage
The following example demonstrates how to configure the power subsystem for a "LRO" (Lunar Reconnaissance Orbiter) spacecraft model.
sat_name = 'LRO'

# Configure power subsystem parameters
wing_area = 10.7          # Total solar panel area of one wing [m^2]
power_out = 1850          # Total end-of-life solar power [W]
cell_efficiency = 0.3     # Typical efficiency for triple-junction solar array
charger_efficiency = 0.95 # Typical charger efficiency
battery_capacity = 2240   # Battery capacity [Wh] (28V * 80Ah)
charge_fraction = 0.8     # Initial charge (80%)
power_consumption = 800   # Baseline power consumption [W]

# 1. Add Solar Panel
# Adds a panel at specific local position and rotation
mds_api.add_solar_panel(
    sat_name,
    [2.6, -0.95, 0],   # Position
    [-90, 0, 0],       # Rotation
    wing_area,
    power_out,
    cell_efficiency,
    True
)

# 2. Add Battery
# Configures the battery with defined capacity and efficiency
mds_api.add_battery(
    sat_name,
    charger_efficiency,
    battery_capacity,
    charge_fraction
)

# 3. Set Consumption
# Sets the constant power draw
mds_api.set_power_consumption(sat_name, power_consumption)
Also for more accurate power consumption model, you can change it dynamically during propagation. See:
example_lunar_orbiter.py.
Code below show how data is retrieved from MDS and save for later plotting:
    for t in range(0, loop_count):
        current_dt = datetime.strptime(mds_api.get_utc_date(), '%Y-%m-%dT%H:%M:%S.%fZ')
        dt_sim_since_start = (current_dt - start_time).total_seconds()

        try:
            _, sat_data = mds_api.get_sat_data(sat_name)
            panel_data = sat_data["spacecraftData"]["solarPanels"][0]
            batteries_data = sat_data["spacecraftData"]["batteries"][0]
        except (KeyError, json.decoder.JSONDecodeError):
            print("Error while getting satellite data")

        charge_status = batteries_data["chargeFloat"]
        time_array.append(dt_sim_since_start)
        generated_power_array.append(panel_data["powerGenerated"])
        charge_array.append(charge_status * 100)
        power_consumption_array.append(current_power_consumption)
        pointing_to_array.append(pointing_to)
After getting data points you can plot it using matplotlib.pyplot library as shown below:
 # Creating plots from data gathered during simulation in MDS
    fig, ax = plt.subplots(2, 2, layout="constrained")


    ax[0,0].plot(time_array, generated_power_array, '#ff9a00', linewidth=2)
    ax[0,0].set(xlabel='Time since start [s]',
           ylabel='Generated power [W]',
           title='Generated power vs time')
    ax[0,0].grid()

    ax[0,1].plot(time_array, charge_array, '#00f0ff', linewidth=2)
    ax[0,1].set(xlabel='Time since start [s]',
            ylabel='Batteries charge [%]',
            title='Battery charge vs time')
    ax[0,1].set_ylim(0, 105)
    ax[0,1].grid()

    ax[1,0].plot(time_array, power_consumption_array, '#d21f3c', linewidth=2)
    ax[1,0].set(xlabel='Time since start [s]',
            ylabel='Power consumption [W]',
            title='Power consumption vs time')
    ax[1,0].grid()

    ax[1,1].step(time_array, pointing_to_array, '#00A86b', linewidth=2, where='post')
    ax[1,1].set(xlabel='Time since start [s]',
            ylabel='Pointing direction',
            title='Pointing direction vs time')

    plt.show()
Below you can see a plot generated by code above.
