MDS Solaris
Grafana
When running MDS Solaris with Grafana enabled, MDS sends real-time data to a configured PostgreSQL server. This data can be visualized using the Grafana application.
MDS Solaris supports Grafana visualization by allowing you to import the provided dashboards. Grafana uses PostgreSQL as a time-series database.
We provide a Docker installation script to install PostgreSQL and Grafana in Docker containers, which can be run locally on the same PC or remotely. It is also possible to use an already existing Grafana installation. The main prerequisites are a PostgreSQL database with time-series support and the correct access permissions.
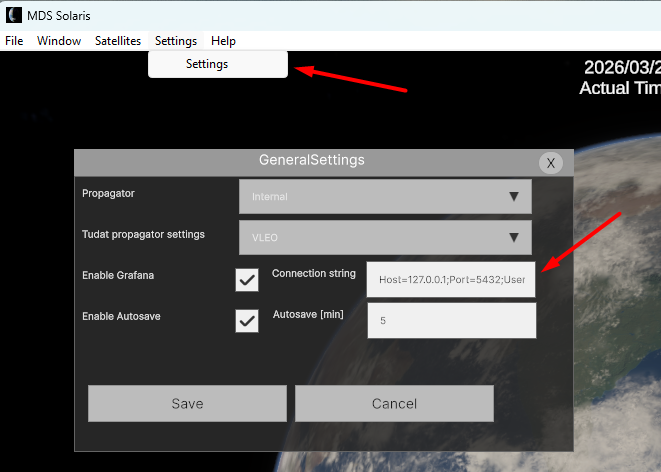
In the MDS settings window, you can specify the PostgreSQL connection string. A default connection string for the standard Grafana installation is already provided:
Host=127.0.0.1;Port=5432;Username=postgres;Password=postgres;Database=metrics;SSL Mode=Disable;
Grafana Installation
Inside Help_API_and_Examples folder there's a script called install_visualization_package_windows/linux which:
Downloads docker using Chocolatey.
Sets up a Postgresql database and Grafana.
Launches Grafana.
On the first run it will install Docker and the script will need a restart:
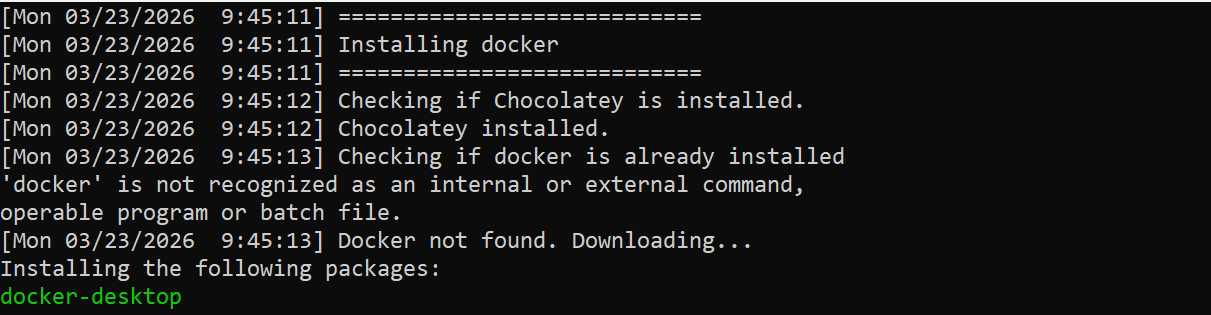
After restarting the script, the expected output should look like this:
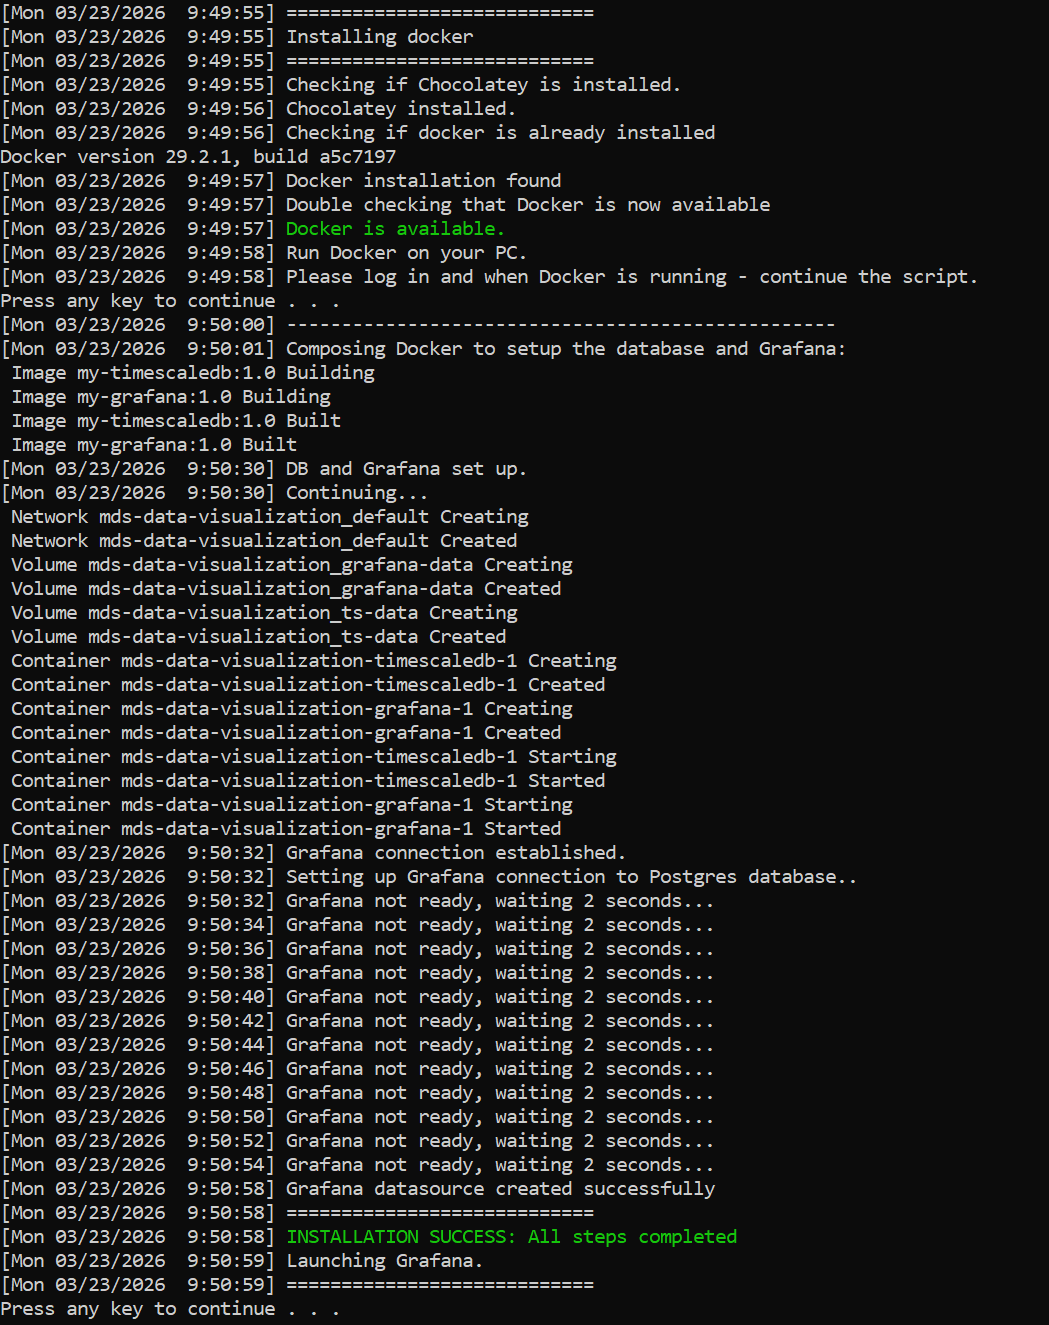
It is recommended to use this script for an easy installation. Follow the instructions in the script to setup. For use cases where a manual installation is preffered or the script does not run, refer to instructions below.
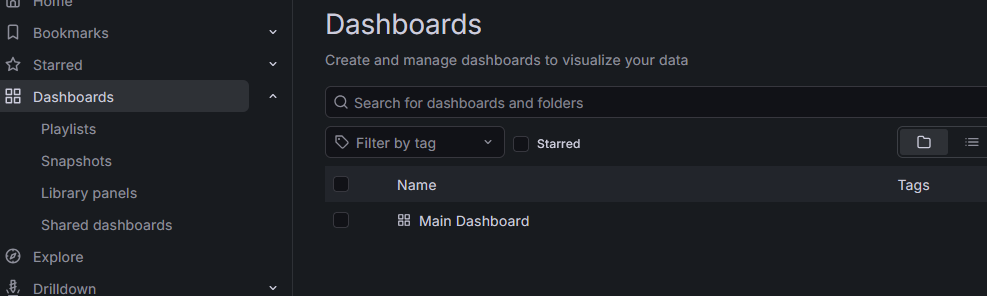
After installing, the database and main dashboard should be automatically set up.
Grafana manual Installation
To install Grafana, first download and install the latest version of Docker Desktop. Docker installation instructions are not covered in this documentation; please refer to the official Docker documentation:
https://docs.docker.com/desktop/setup/install/windows-install/
For monitoring the data in the database, pgadmin4 is recommended:
https://www.pgadmin.org/download/pgadmin-4-windows/
In the MDS-Data-Visualization folder, you will find the Grafana installation script:
docker-compose.yaml
Manual installation instructions
Start the Docker Desktop application.
Open the Windows command line in the MDS-Data-Visualization folder. You can do so by navigating to the folder and pressing SHIFT+Right click.
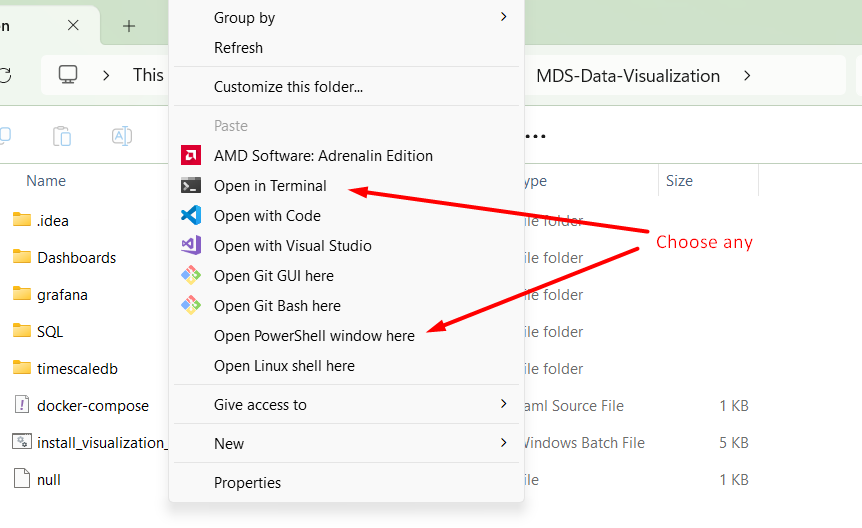
Run the following command:
docker compose build
After the Docker image is created, run it using Docker Desktop or by running this command:
docker compose up -d
Then open your browser and navigate to:
http://localhost:3000/
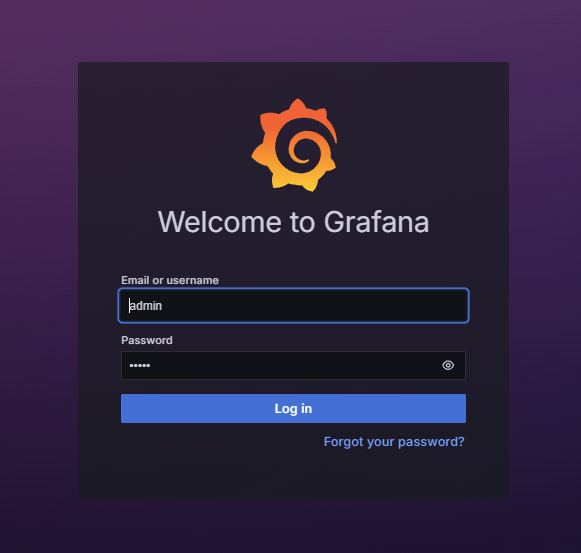
Grafana will open in your browser. The default username and password are:
admin / admin
Setup PostgreSQL connection
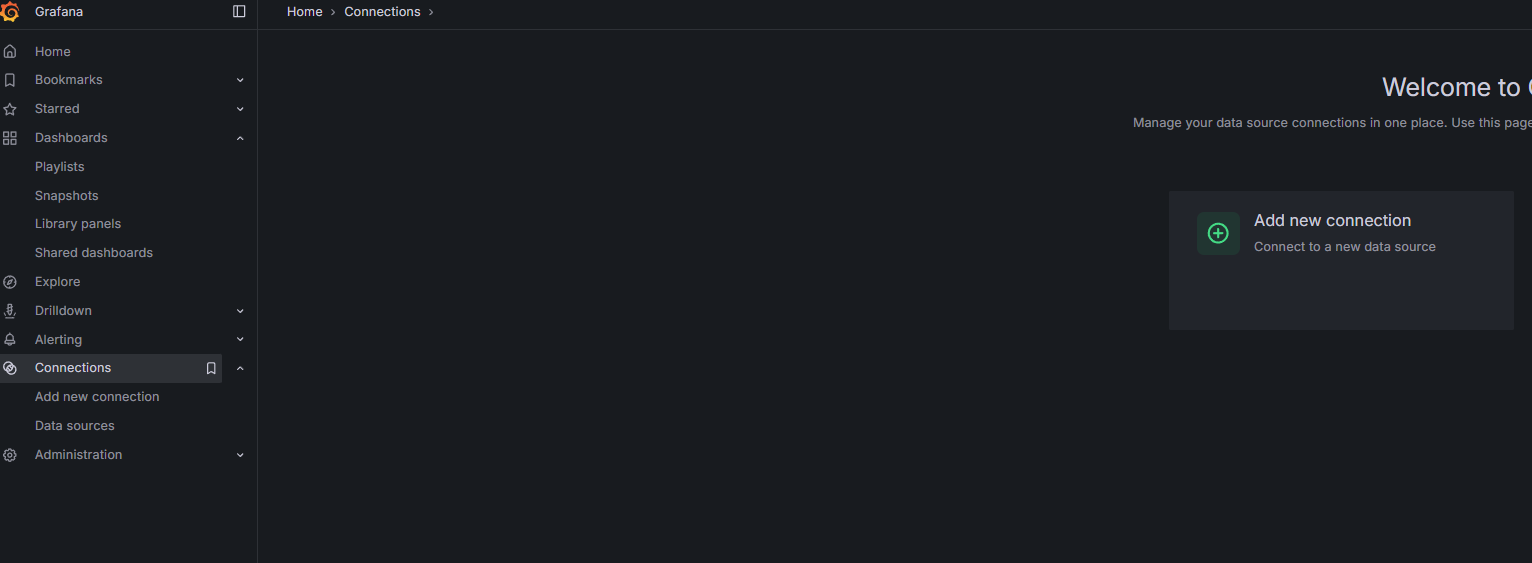
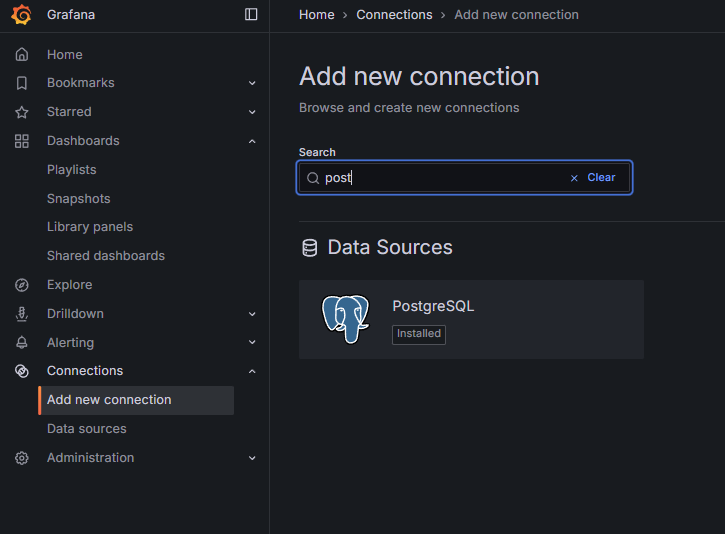
From the Grafana menu, select Connections and click Add new connection.
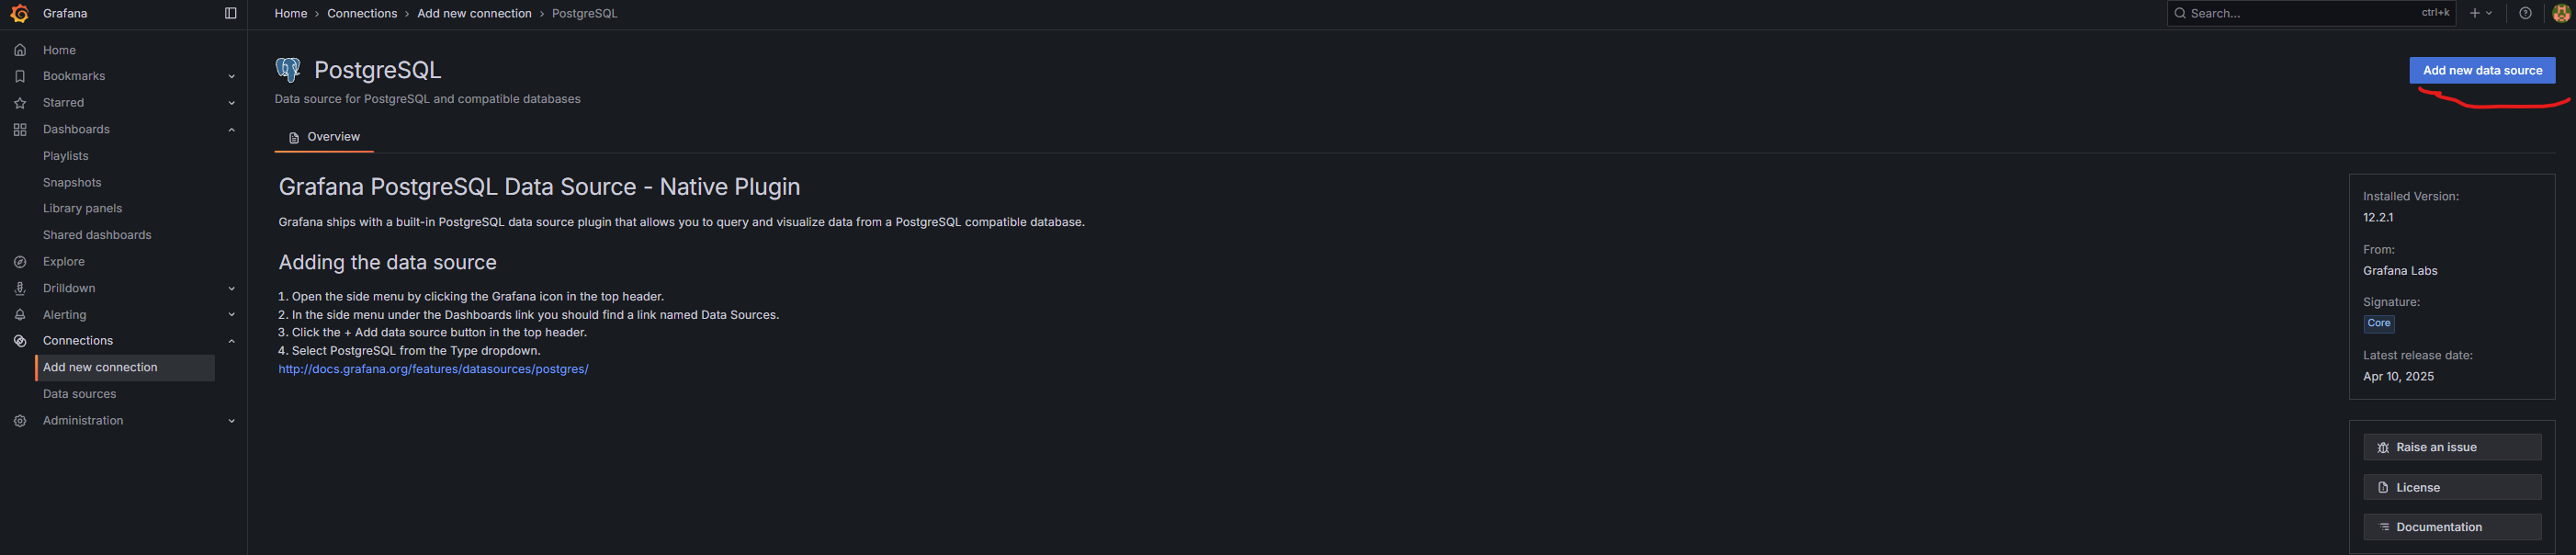
Select PostgreSQL as the connection type.
In the top-right corner, select Add new datasource.
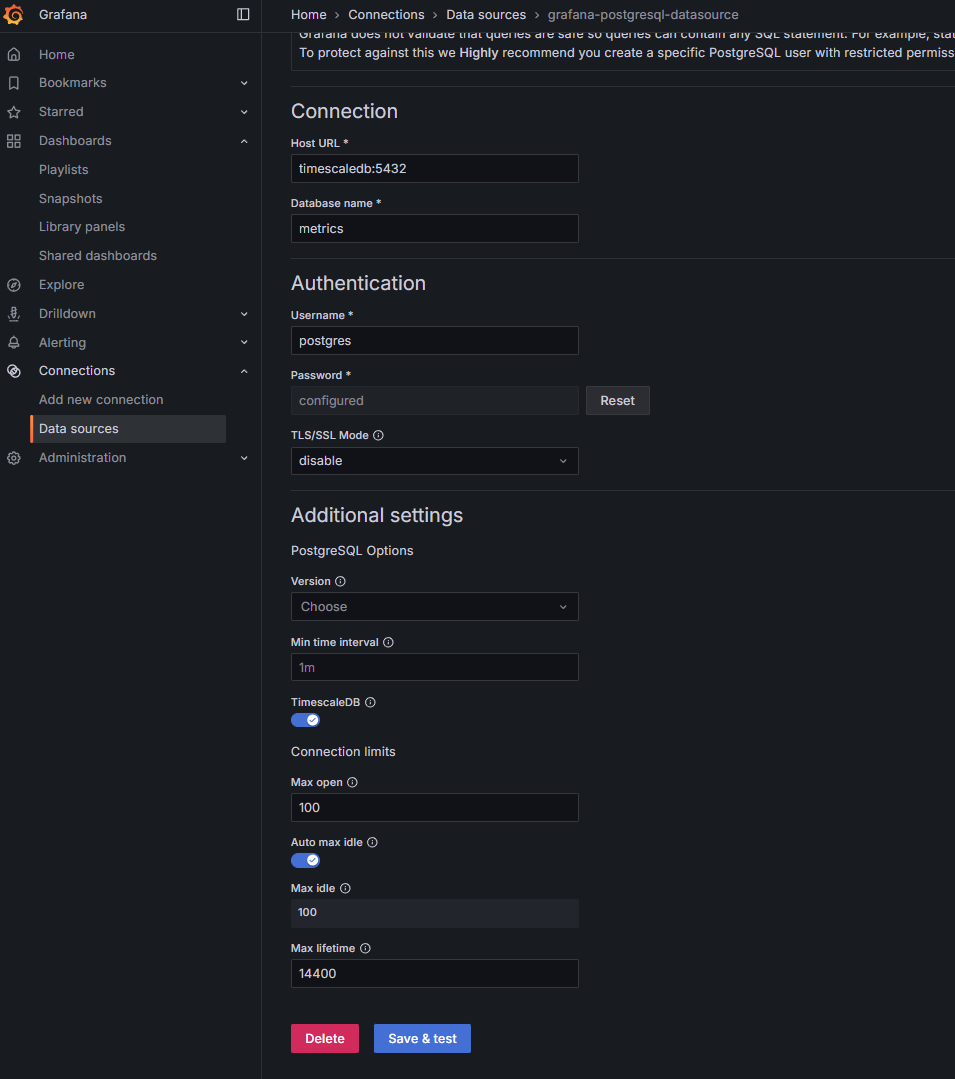
Configure the connection as shown in the screenshot and set the password to postgres.
Click Save. Grafana is now fully configured.
Host URL:
timescaledb:5432
Database name:
metrics
Username:
postgres
Password:
postgres
What data is exported from MDS Solaris
Currently, the data is primarily exported when simulating fleets. The data consists of relative measurements, ground tracks, visibility, coverage.
Please run python example "example_compute_fleet_coverage.py" to generate examplary data.
Caution: You must set the same date for graph visualization as propagation date in this example. Keep attention to the dashboard query and what time is used for visualization.
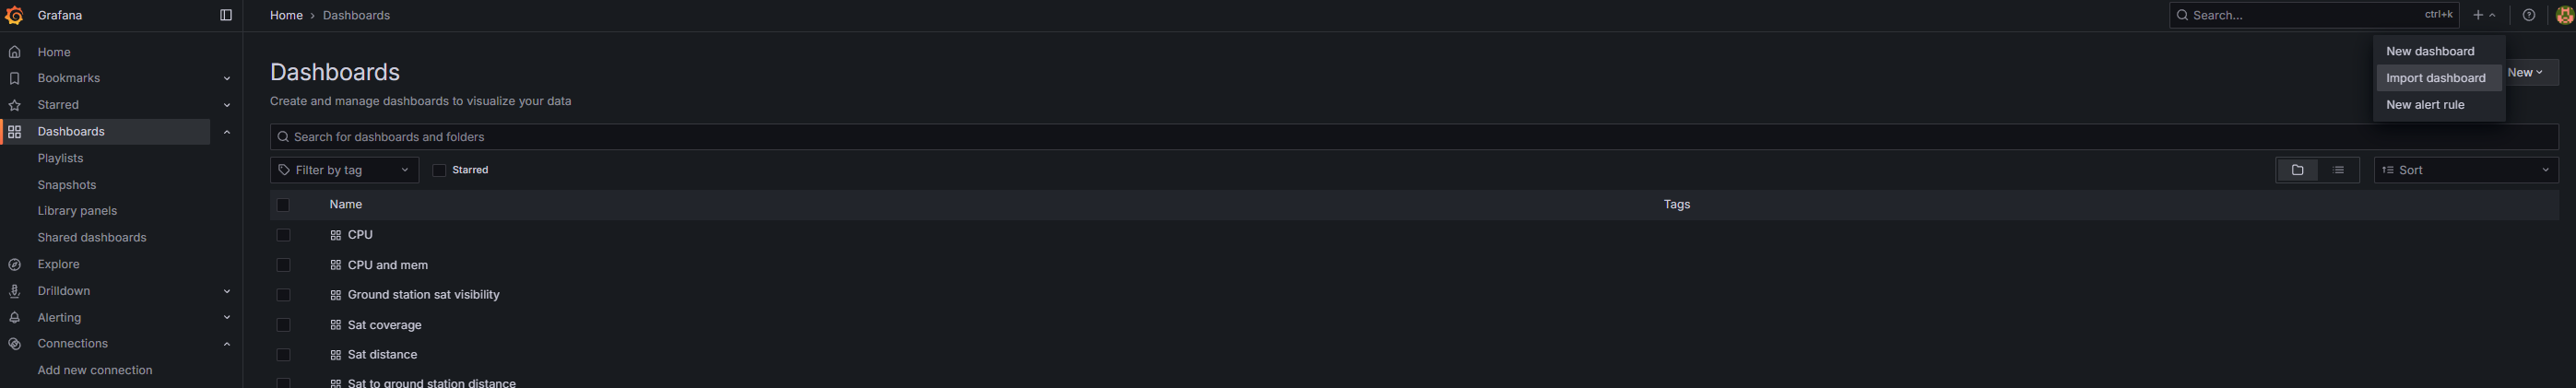
Dashboards
The MDS installation includes several useful dashboards. These dashboards can be found in the MDS-Data-Visualization/dashboards folder and are provided in JSON format. They can be imported using the Grafana user interface.
List of dashboards
fleet_velocity.json
ground_station_sat_visibility.json
realtime_velocity.json
main_dashboard
sat_coverage.json
sat_distance.json
sat_ground_station_distance.json
Fleet velocity
Displays satellite velocities for the entire fleet.
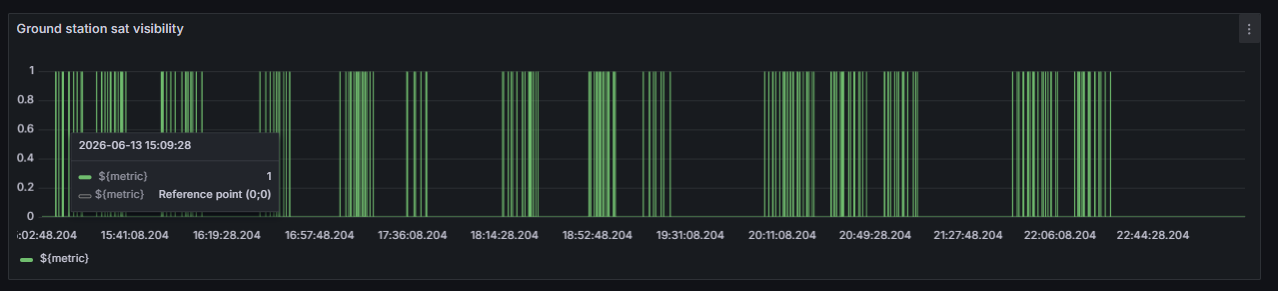
Ground station satellite visibility
Displays ground stations and indicates when the selected satellite is visible.
Realtime satellite velocity
Displays the current velocity of a satellite in real time.
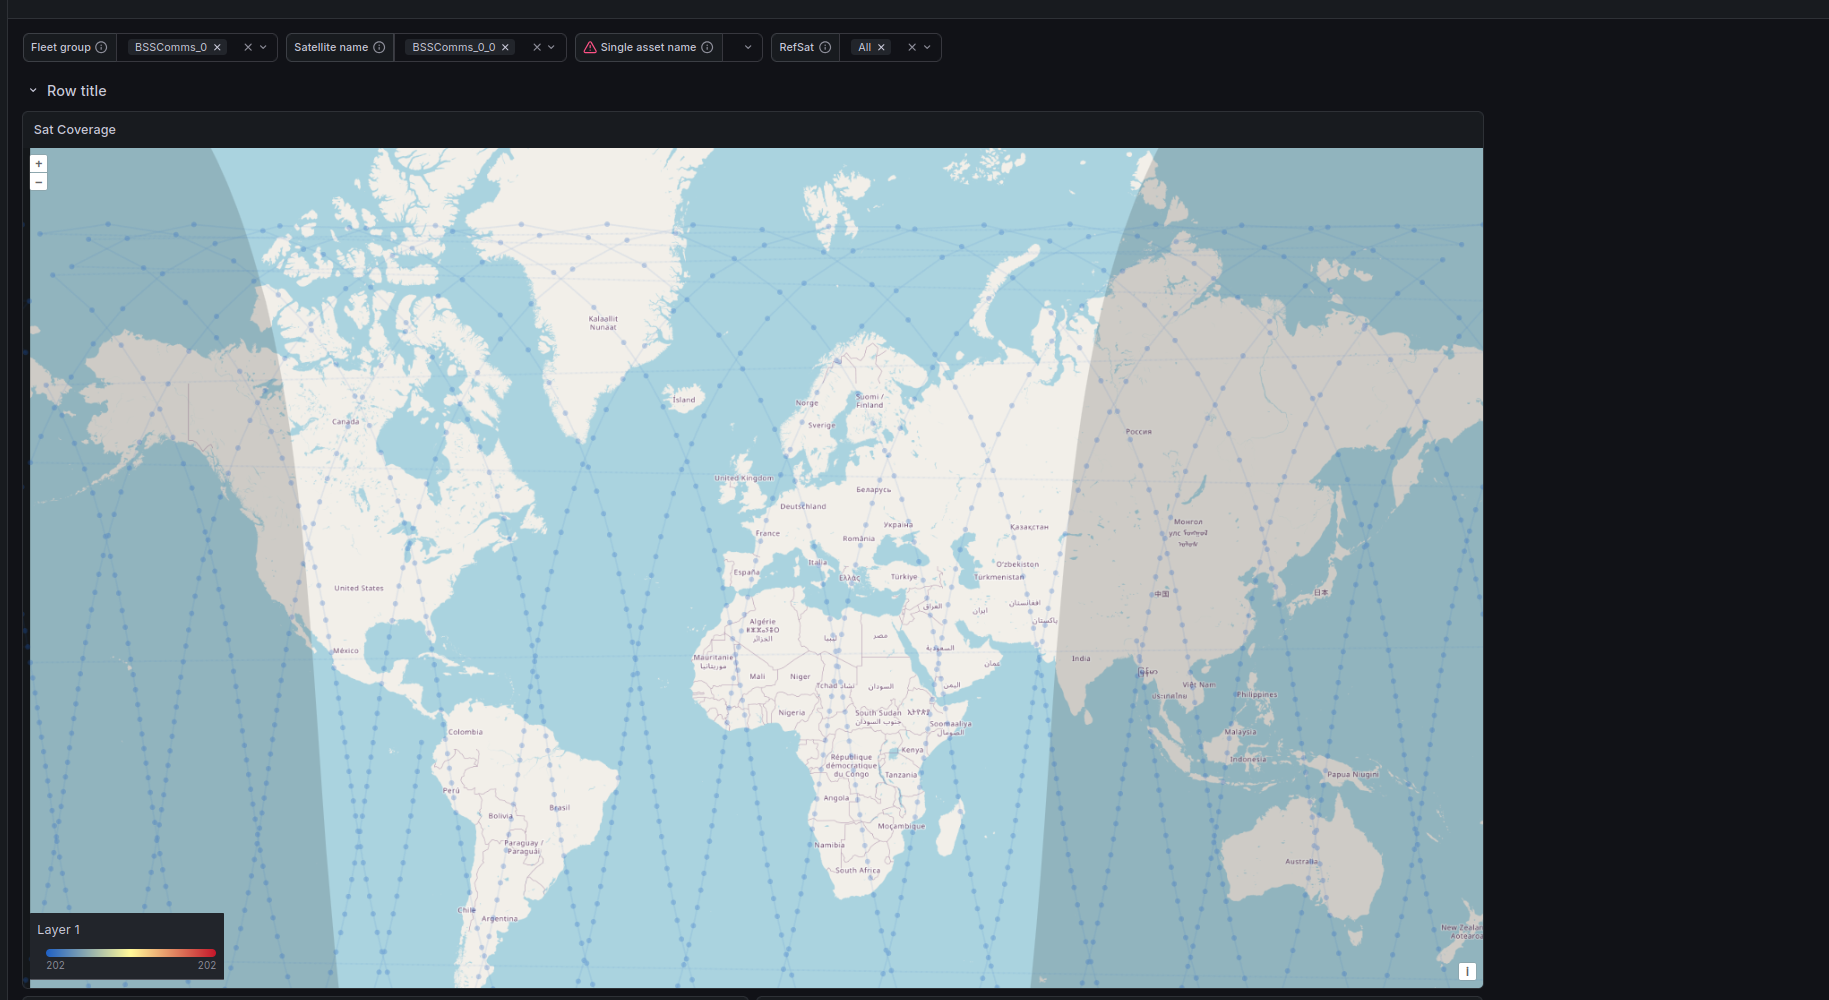
Main dashboard
Main examplary dashboard which queries variables from the database. Shows satellite position/velocity/acceleration metrics as well as their relative metrics. Displays satellite coverage. If Grafana is installed using installer - this dashboard is imported automatically.
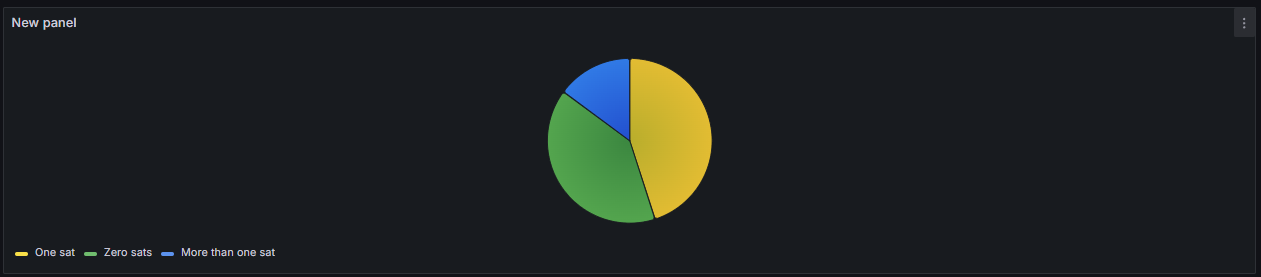
Satellite ground station coverage
Displays the number of passes a satellite has made over ground stations.
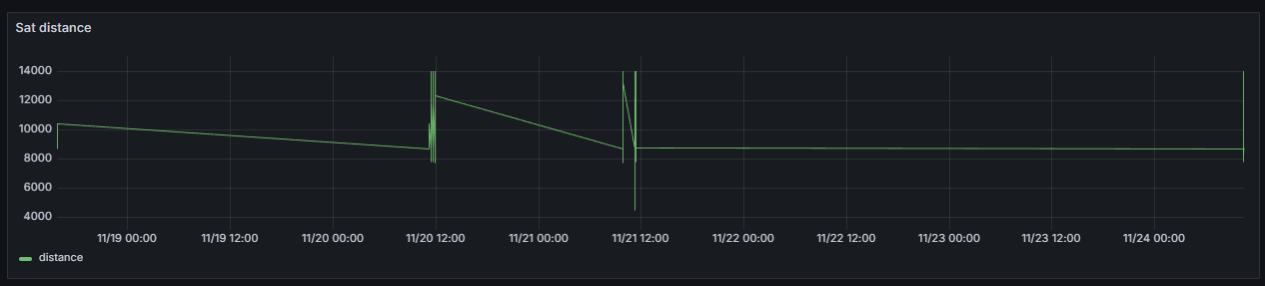
Distance between satellites
Displays the distance between selected satellites.
Satellite ground station distances
Displays the distance between a satellite and a ground station.
PostgreSQL tables created by MDS
This information can be useful if you want to create your own custom dashboards or queries.
It is recommended to view the database data in a convenient way to make queries. pgadmin4 is used in screenshots below.
For more information on how to create dashboards, visit the official Grafana page:
https://grafana.com/docs/
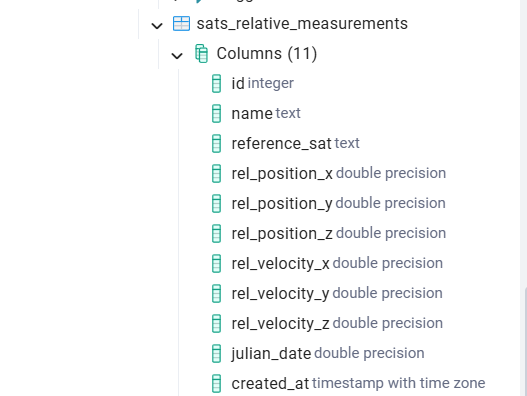
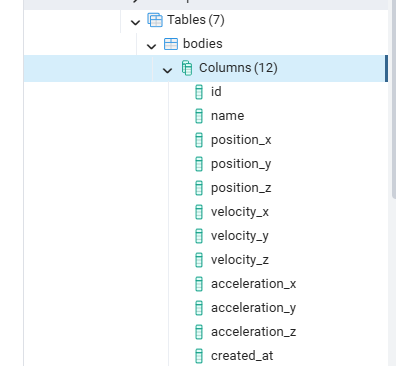
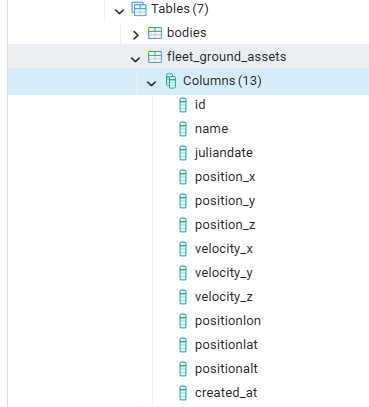
Each column represents what data is provided in one row at one time step.
bodies
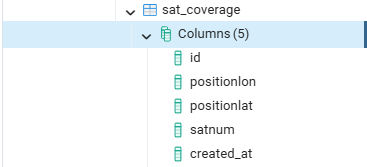
sat_coverage
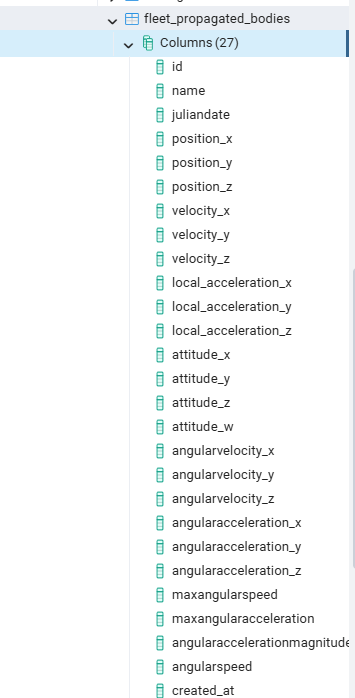
fleet_propagated_bodies
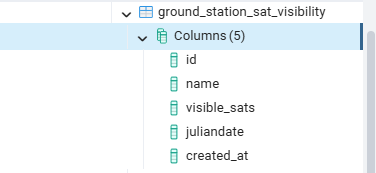
ground_station_sat_visibility
fleet_ground_assets
sat_tracking
![]()
sats_relative_measurements