MDS Solaris - data visualization
MDS Solaris provides the capability to export simulation data to a PostgreSQL database, enabling efficient storage and analysis of simulation results. The PostgreSQL database can be connected to Grafana for interactive visualization and monitoring of simulation data through customizable dashboards.
Several example Grafana dashboards are provided in the following directory:
Help_API_and_Examples\MDS-Data-Visualization
These examples demonstrate different approaches for visualizing MDS simulation outputs and can be used as templates for creating custom dashboards.
MDS Solaris provides a Docker installation script for deploying PostgreSQL and Grafana as separate Docker containers. The containers can be hosted locally on the same machine running MDS Solaris or deployed on a remote system. The primary requirements for using MDS with Grafana are access to a PostgreSQL database with time-series data support and the necessary database permissions for data insertion and querying.
The PostgreSQL connection parameters can be configured in the MDS Settings window. A default connection string for the standard local Grafana installation is provided:
Host=127.0.0.1;Port=5432;Username=postgres;Password=postgres;Database=metrics;SSL Mode=Disable;
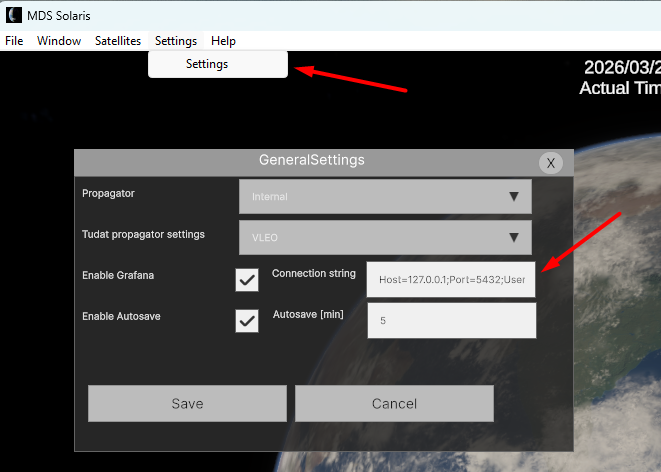
To enable simulation data export to PostgreSQL, ensure that Enable Grafana is activated in the MDS Settings window. When enabled, relevant simulation data will be written to the configured PostgreSQL database during execution.
Grafana Installation
Inside Help_API_and_Examples folder there's a script called install_visualization_package_windows/linux which:
Downloads docker using Chocolatey.
Sets up a Postgresql database and Grafana.
Launches Grafana.
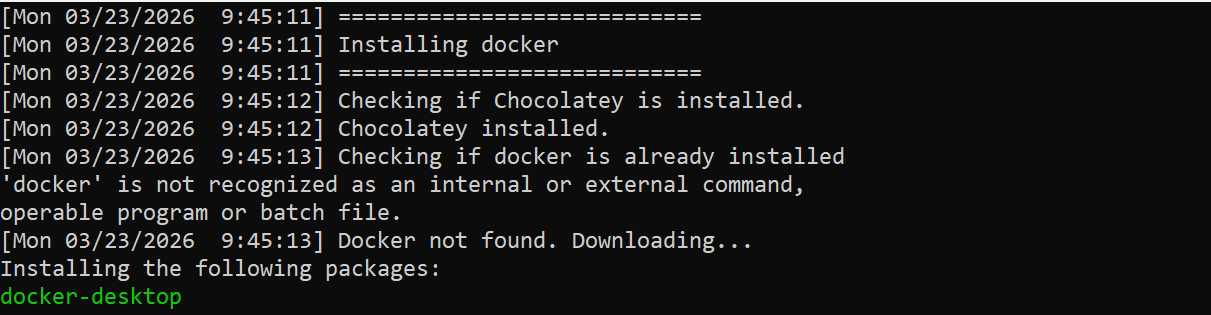
On the first run it will install Docker and the script will need a restart:
After restarting the script, the expected output should look like this:
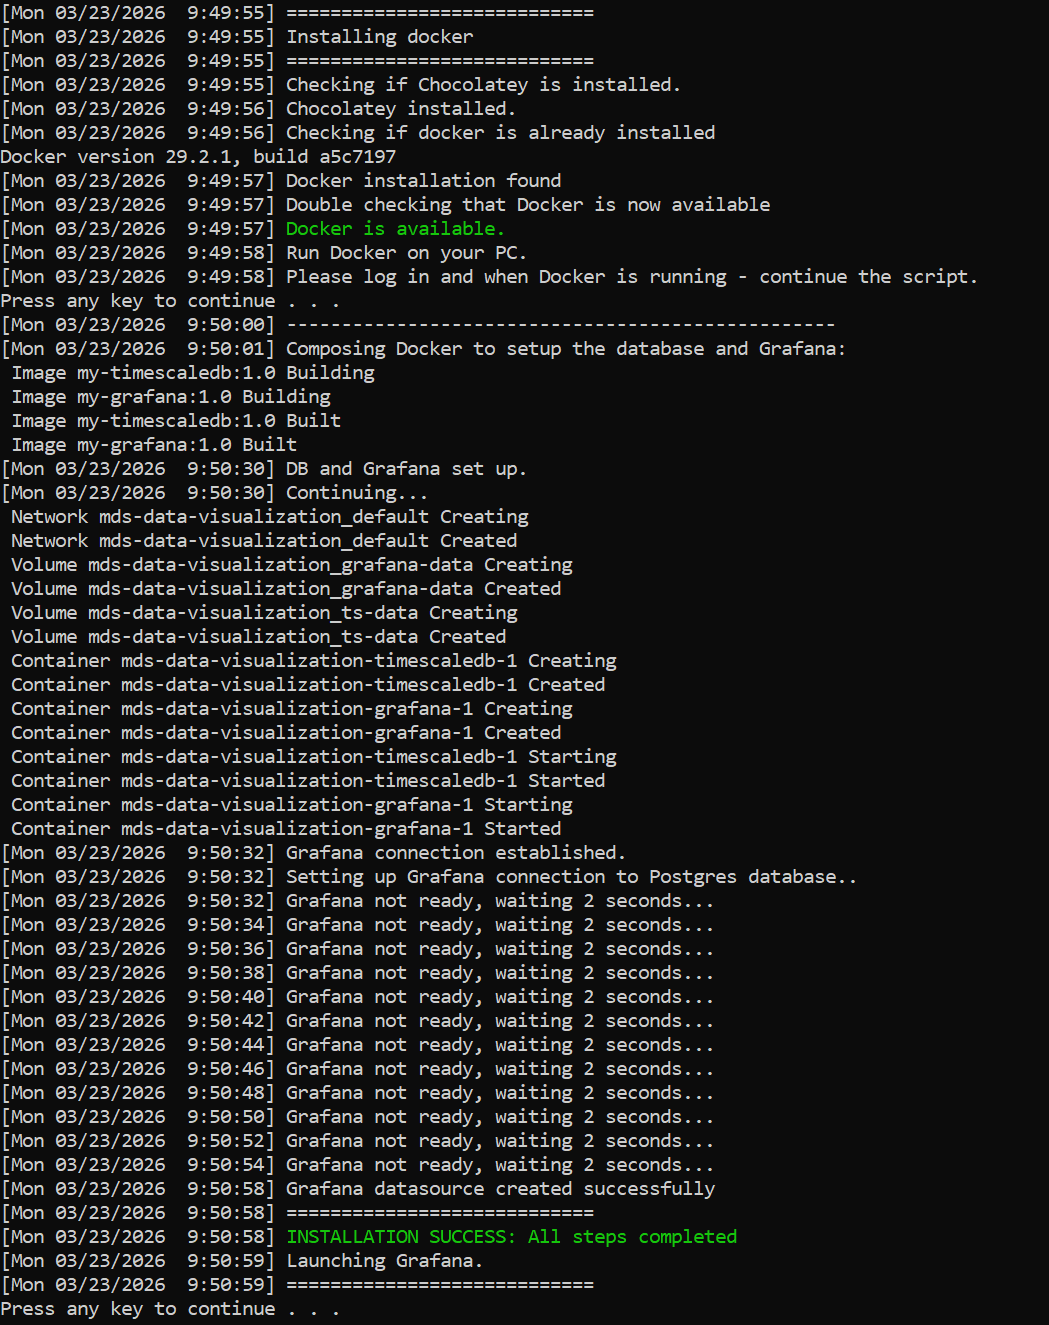
It is recommended to use this script for an easy installation. Follow the instructions in the script to setup. For use cases where a manual installation is preffered or the script does not run, refer to instructions below.
Grafana will open in your browser. The default username and password are: admin / admin
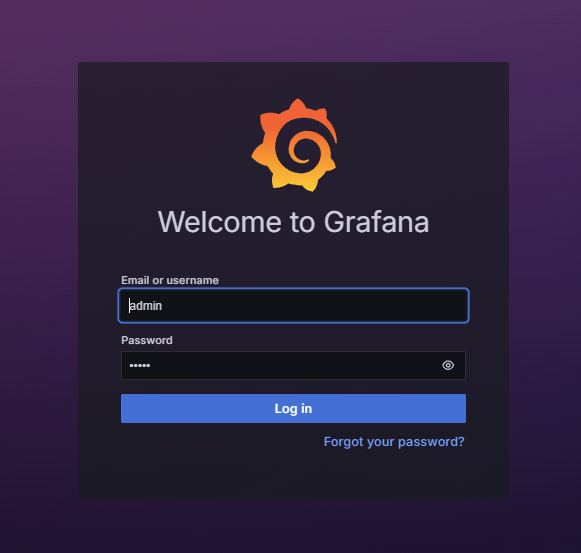
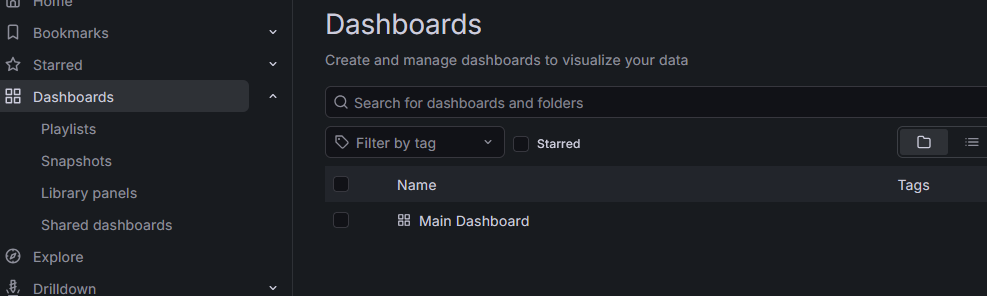
After installing, the database and main dashboard should be automatically set up.
Grafana manual Installation
To install Grafana, first download and install the latest version of Docker Desktop. Docker installation instructions are not covered in this documentation; please refer to the official Docker documentation:
https://docs.docker.com/desktop/setup/install/windows-install/
For monitoring the data in the database, pgadmin4 is recommended:
https://www.pgadmin.org/download/pgadmin-4-windows/
In the MDS-Data-Visualization folder, you will find the Grafana installation script:
docker-compose.yaml
Manual installation instructions
Start the Docker Desktop application.
Open the Windows command line in the MDS-Data-Visualization folder. You can do so by navigating to the folder and pressing SHIFT+Right click.
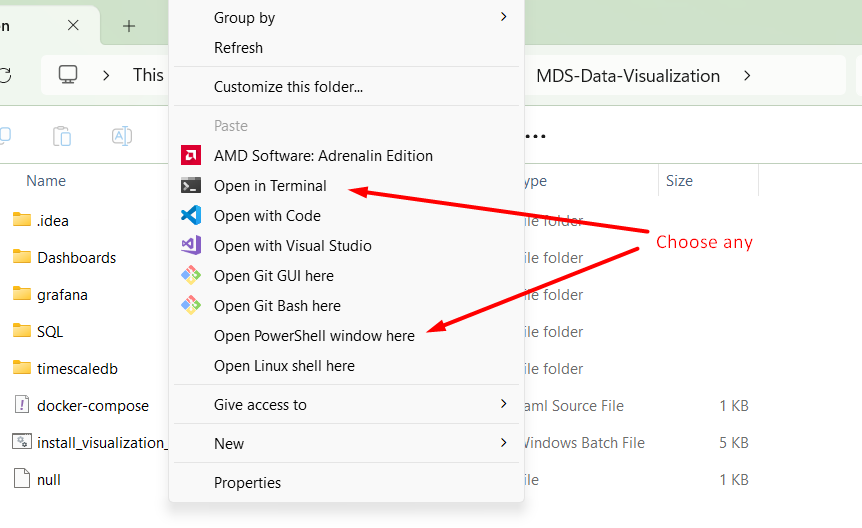
Run the following command:
docker compose build
After the Docker image is created, run it using Docker Desktop or by running this command:
docker compose up -d
Then open your browser and navigate to:
http://localhost:3000/
Grafana will open in your browser. The default username and password are:
admin / admin
Setup PostgreSQL connection
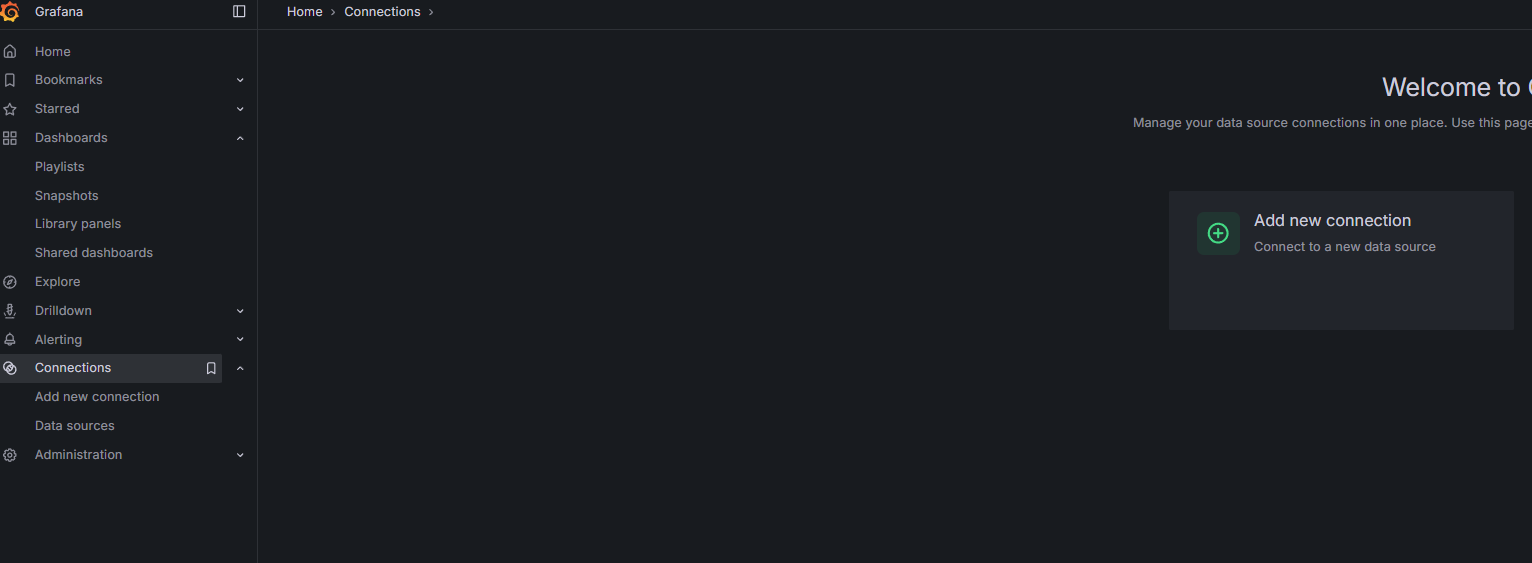
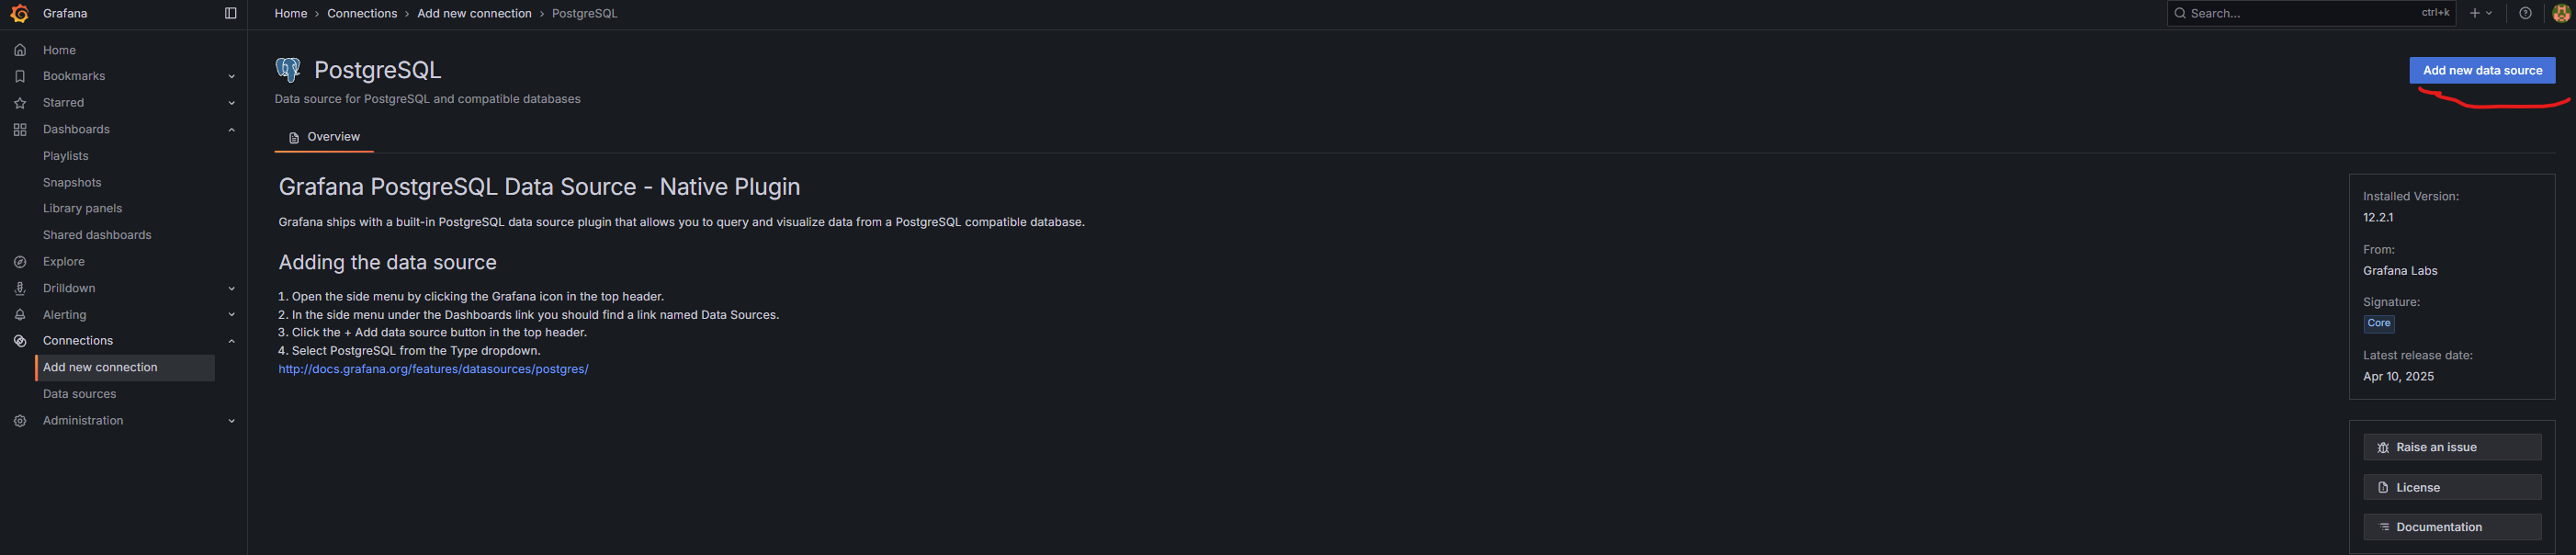
From the Grafana menu, select Connections and click Add new connection.
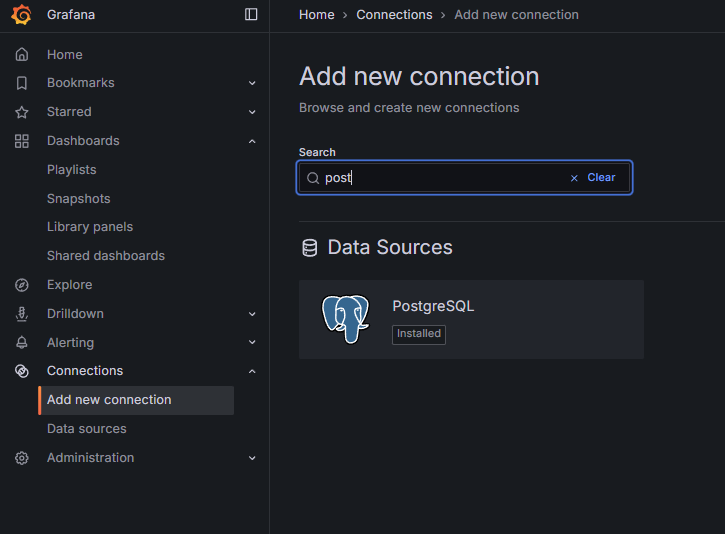
Select PostgreSQL as the connection type.
In the top-right corner, select Add new datasource.
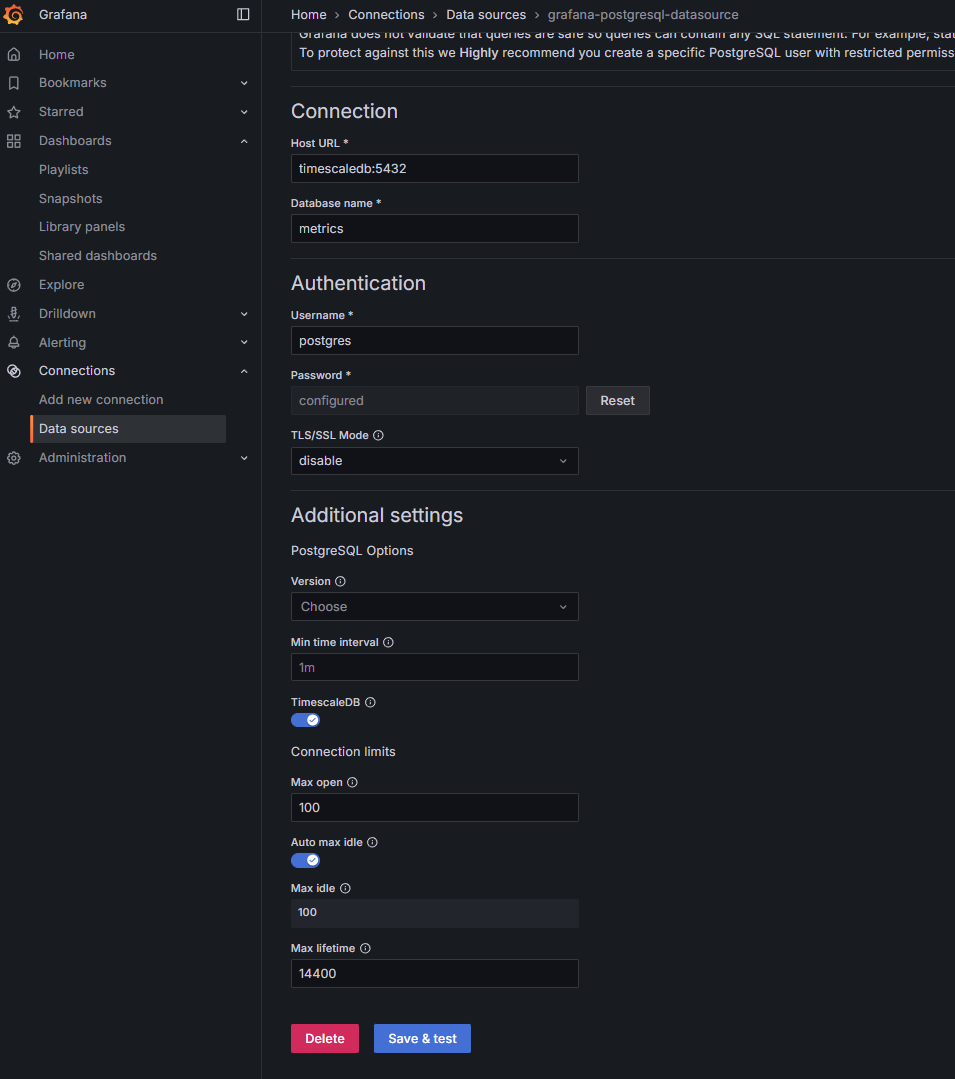
Configure the connection as shown in the screenshot and set the password to postgres.
Click Save. Grafana is now fully configured.
Host URL:
timescaledb:5432
Database name:
metrics
Username:
postgres
Password:
postgres
Postgres version can be left as default (newest).
Dashboards
The MDS installation includes several useful dashboards. These dashboards can be found in the MDS-Data-Visualization/dashboards folder and are provided in JSON format. They can be imported using the Grafana user interface.

Dashboard Setup
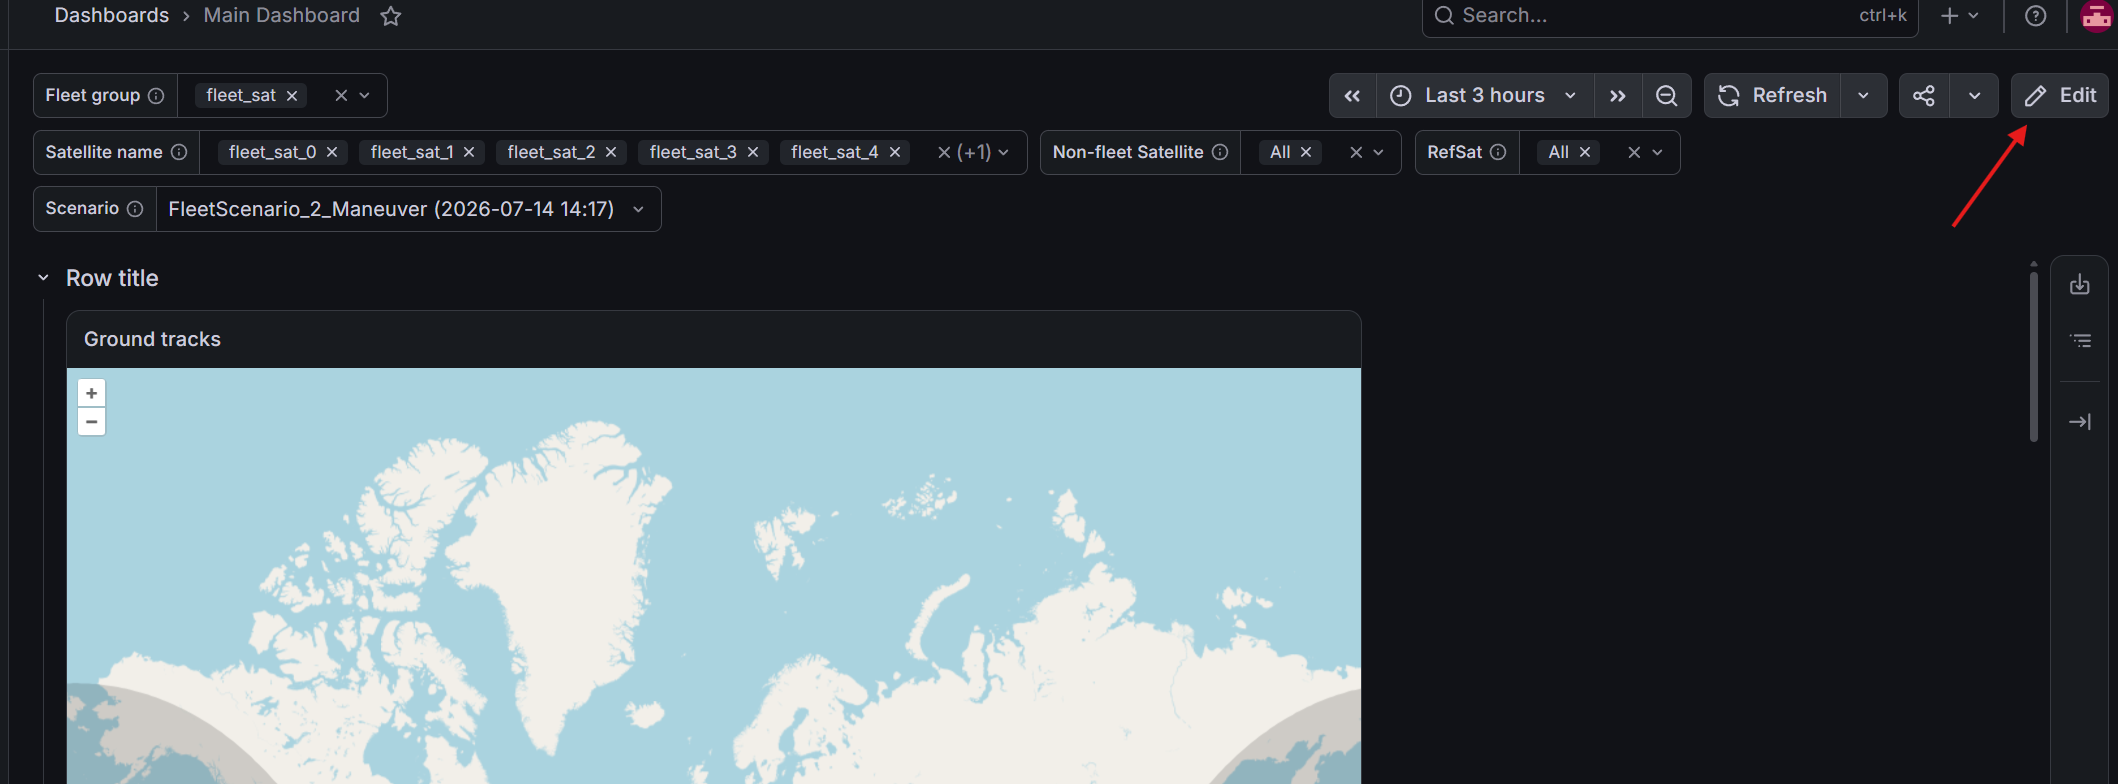
In order to receive real-time information on the dashboards, the data source needs to be configured manually. After importing the required dashboards, open the Main Dashboard. Enter Edit mode:
Open Dashboard Options -> View All Settings:
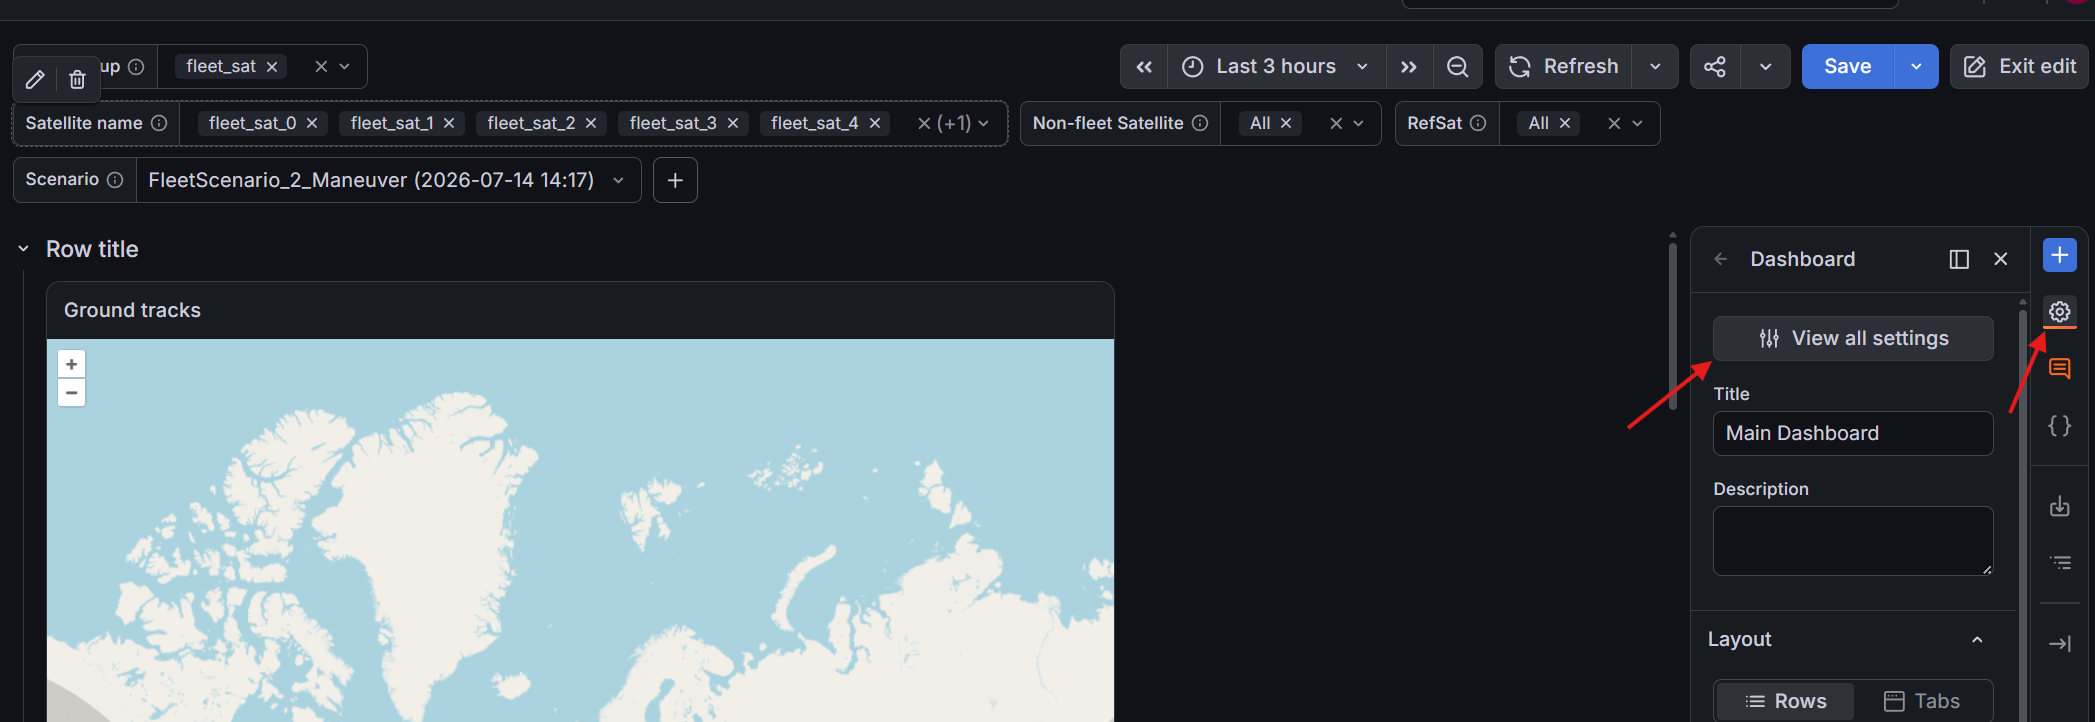
After clicking the Variables tab, you should see a list of variables with links:
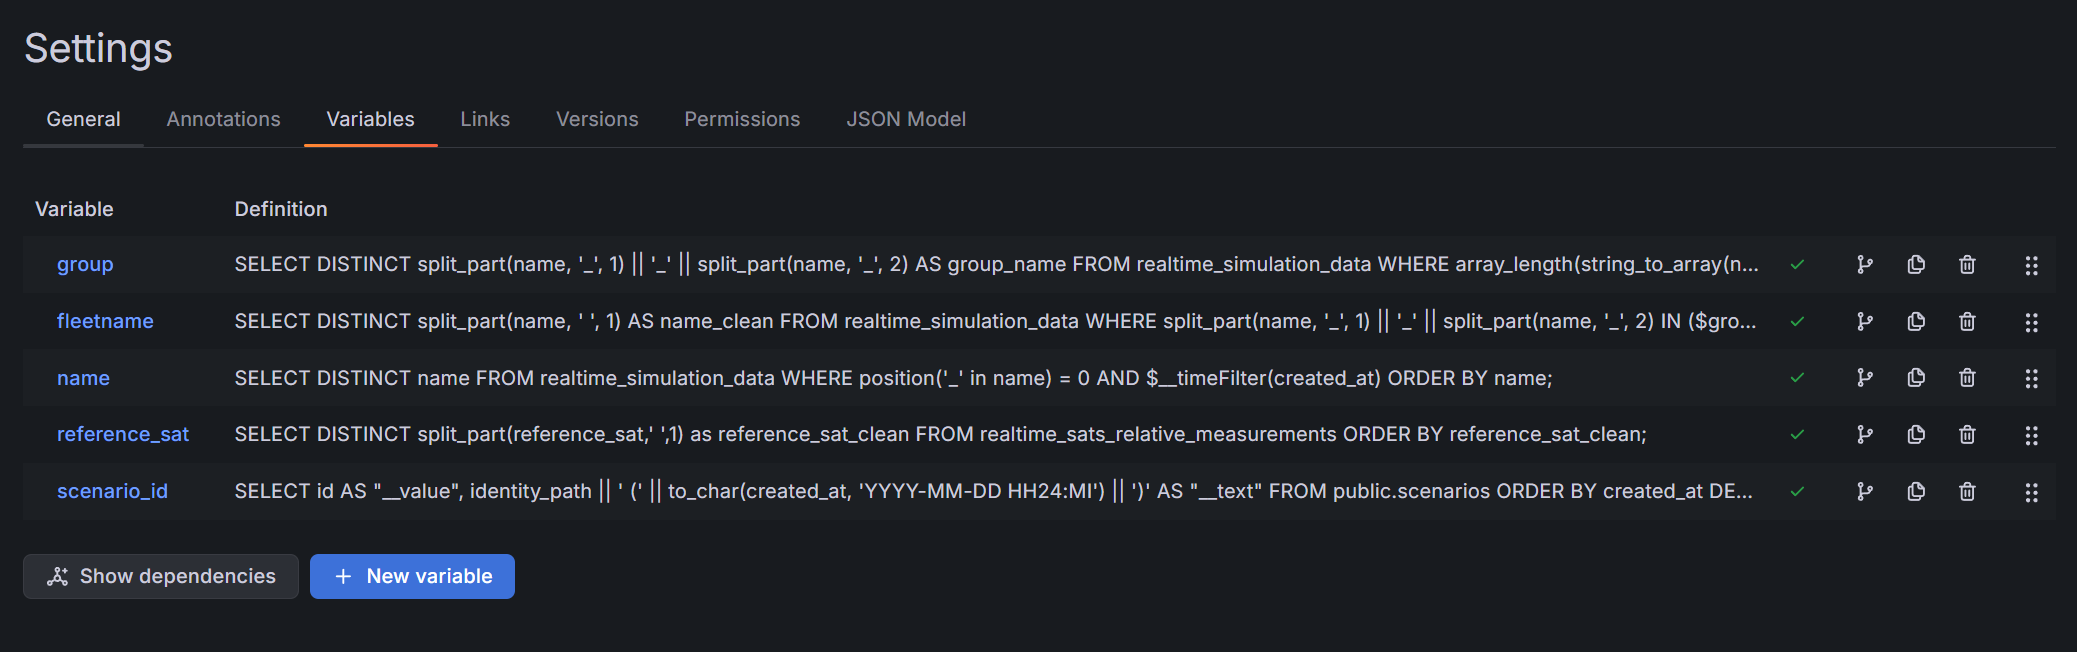
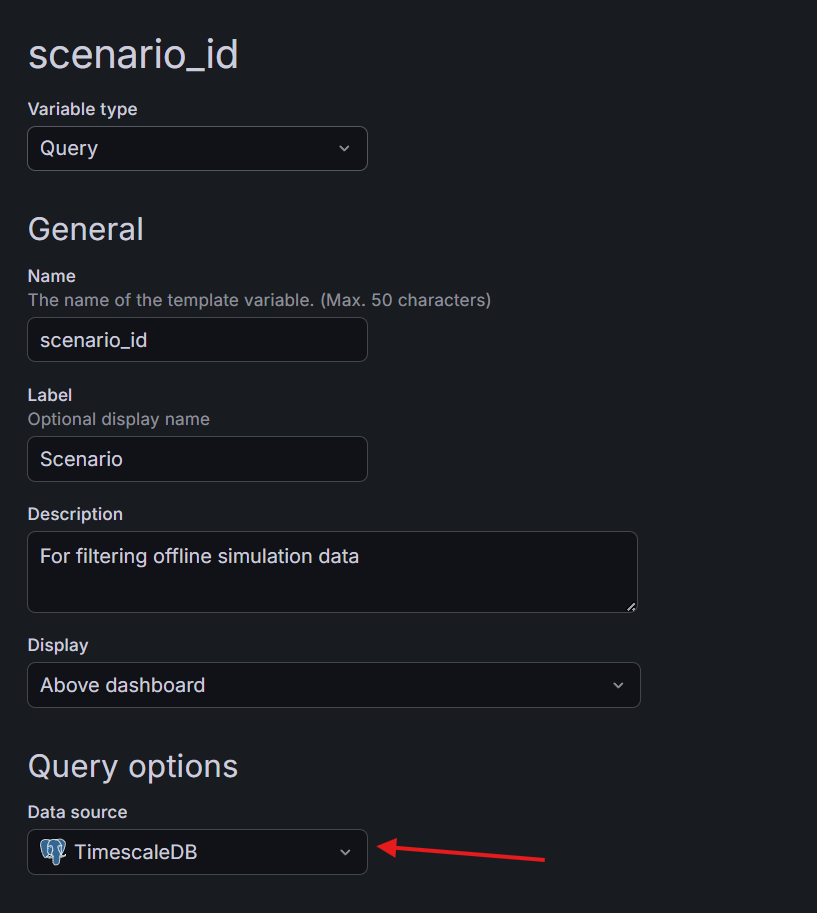
For each variable, change the data source to "TimescaleDB":
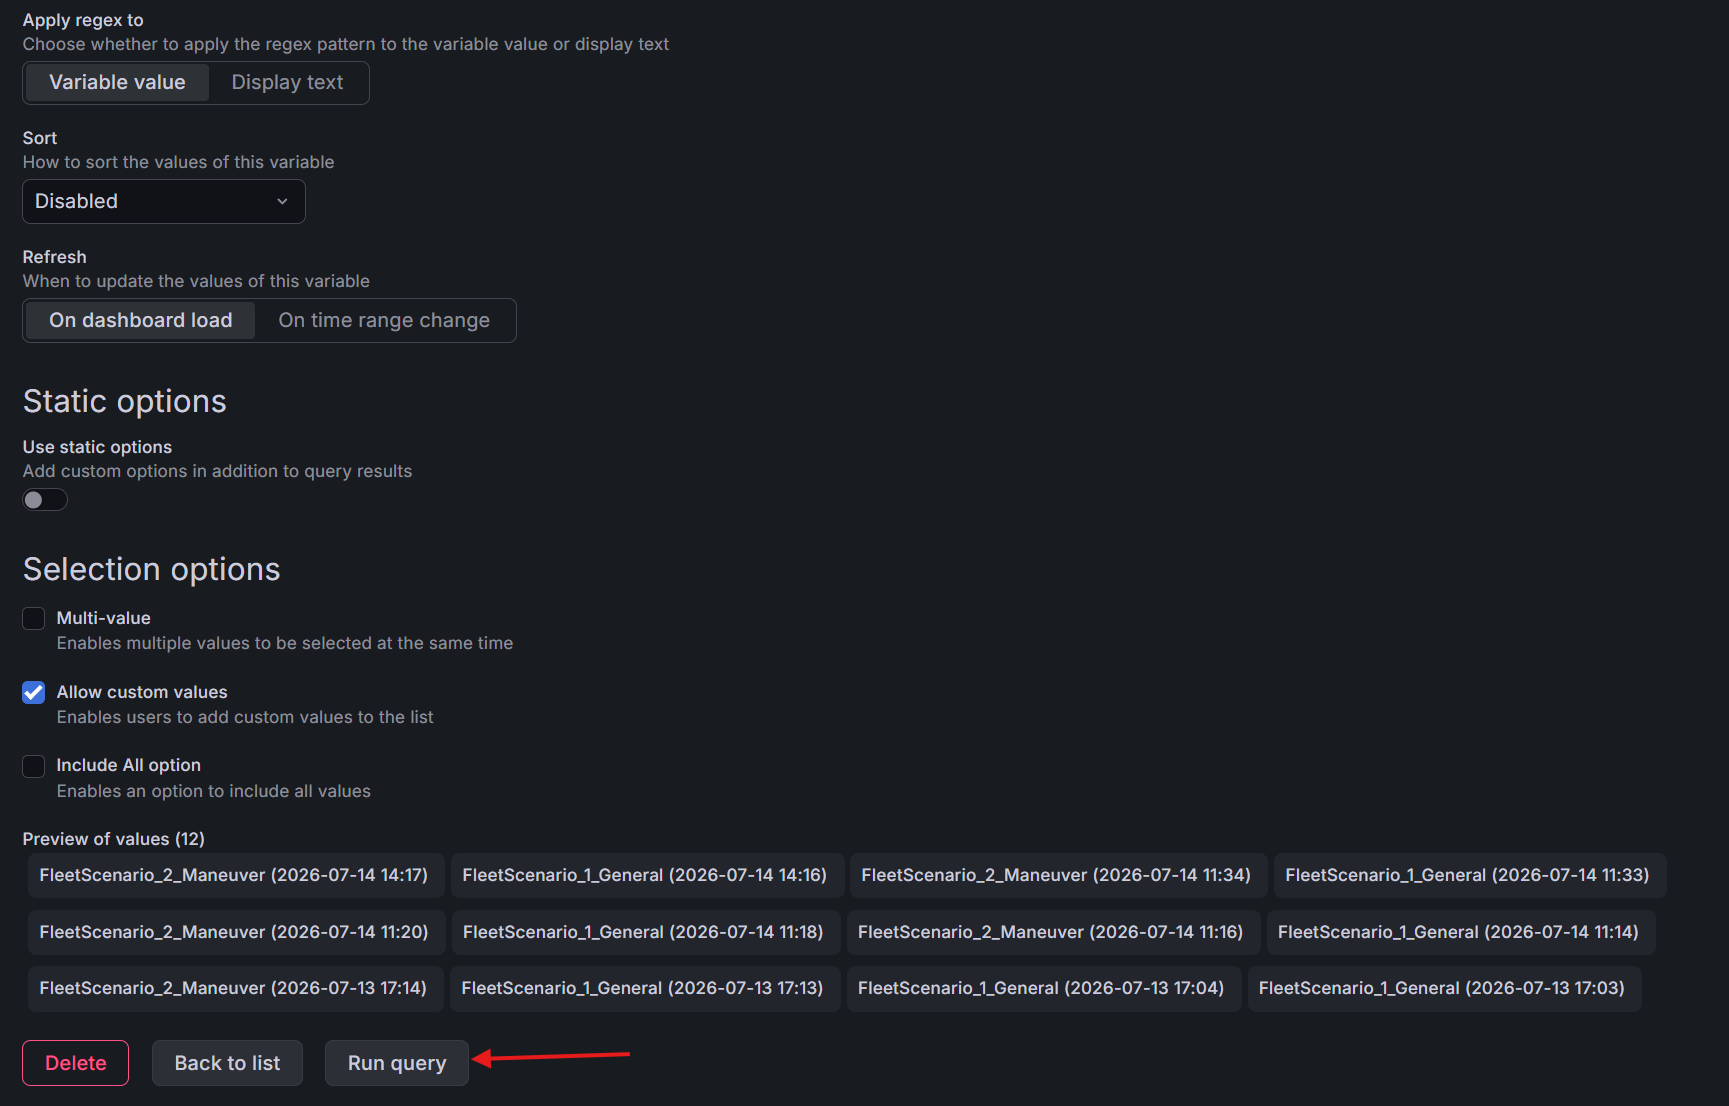
And click "Run Query":
Save the dashboard in the top right of the screen, and return to the dashboard, which will update in real time when a fleet is set up in MDS.
List of dashboards
conjunction_monitoring.json
ground_station_passes.json
main_dashboard.json
maneuvers_dashboard.json
realtime_relative_measurements.json
scenario_fleet_coverage_comparison.json
Conjunction monitoring
Displays upcoming and passed Collision Detection Messages (CDMs).
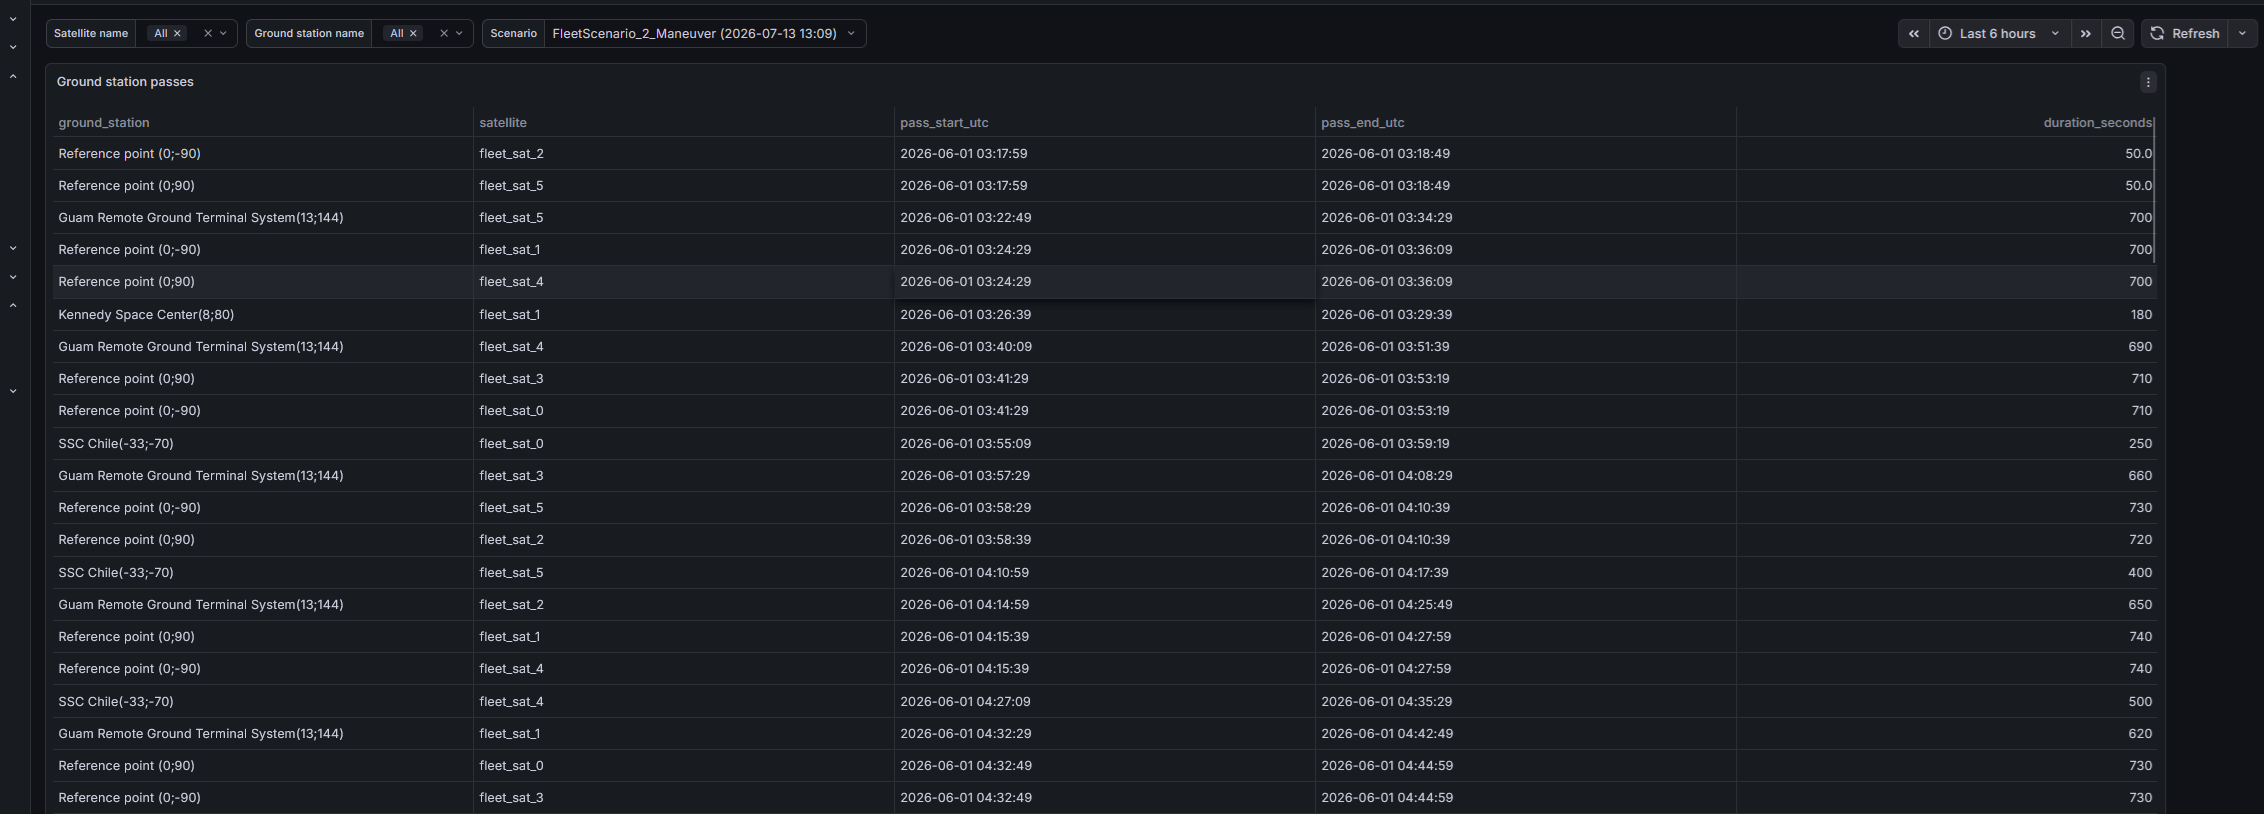
Ground station passes
Displays simulated ground station passes in a scenario.
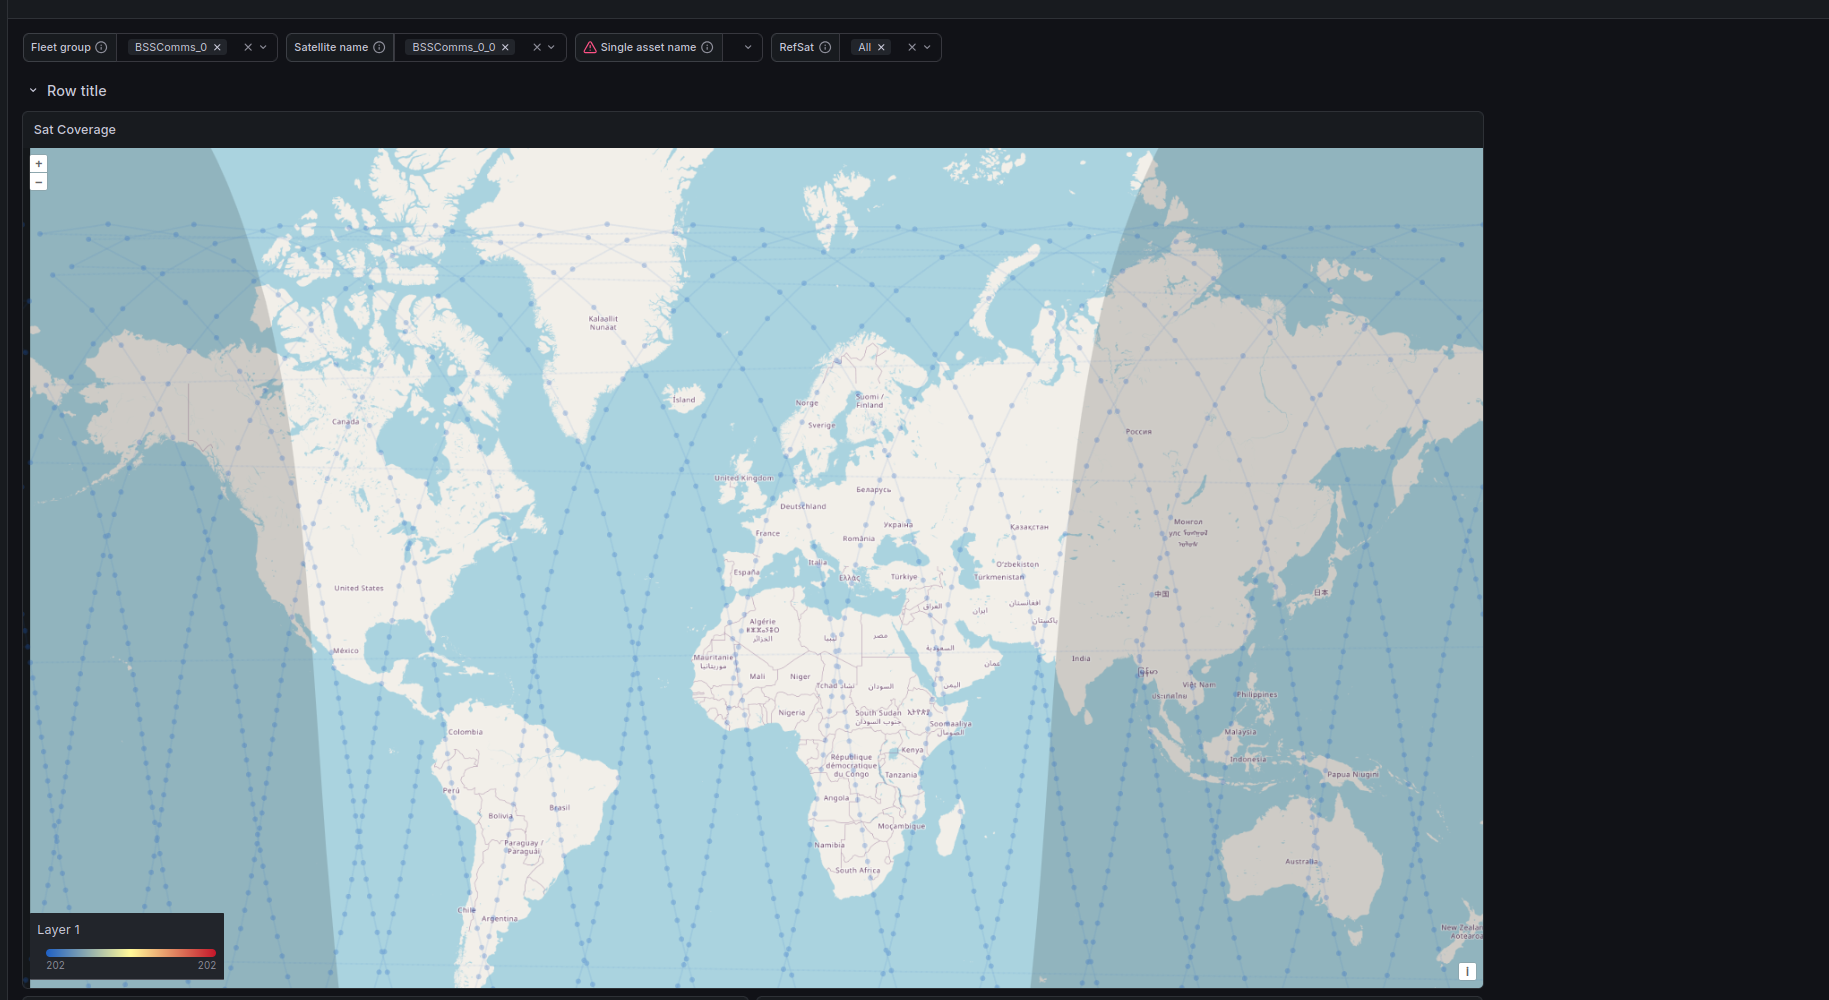
Main dashboard
Main examplary dashboard which queries variables from the database. Shows satellite position/velocity/acceleration metrics as well as their relative metrics. Displays satellite ground tracks. All data is taken from the main simulation with ground tracks and revisits taken from scenarios. If Grafana is installed using installer - this dashboard is imported automatically.
This dashboard tries to query separate satellites that are not in a fleet. If no such satellites exist in the simulation - satellite velocity/acceleration won't be displayed. All other dashboards are designed to take constellation satellites into the query.
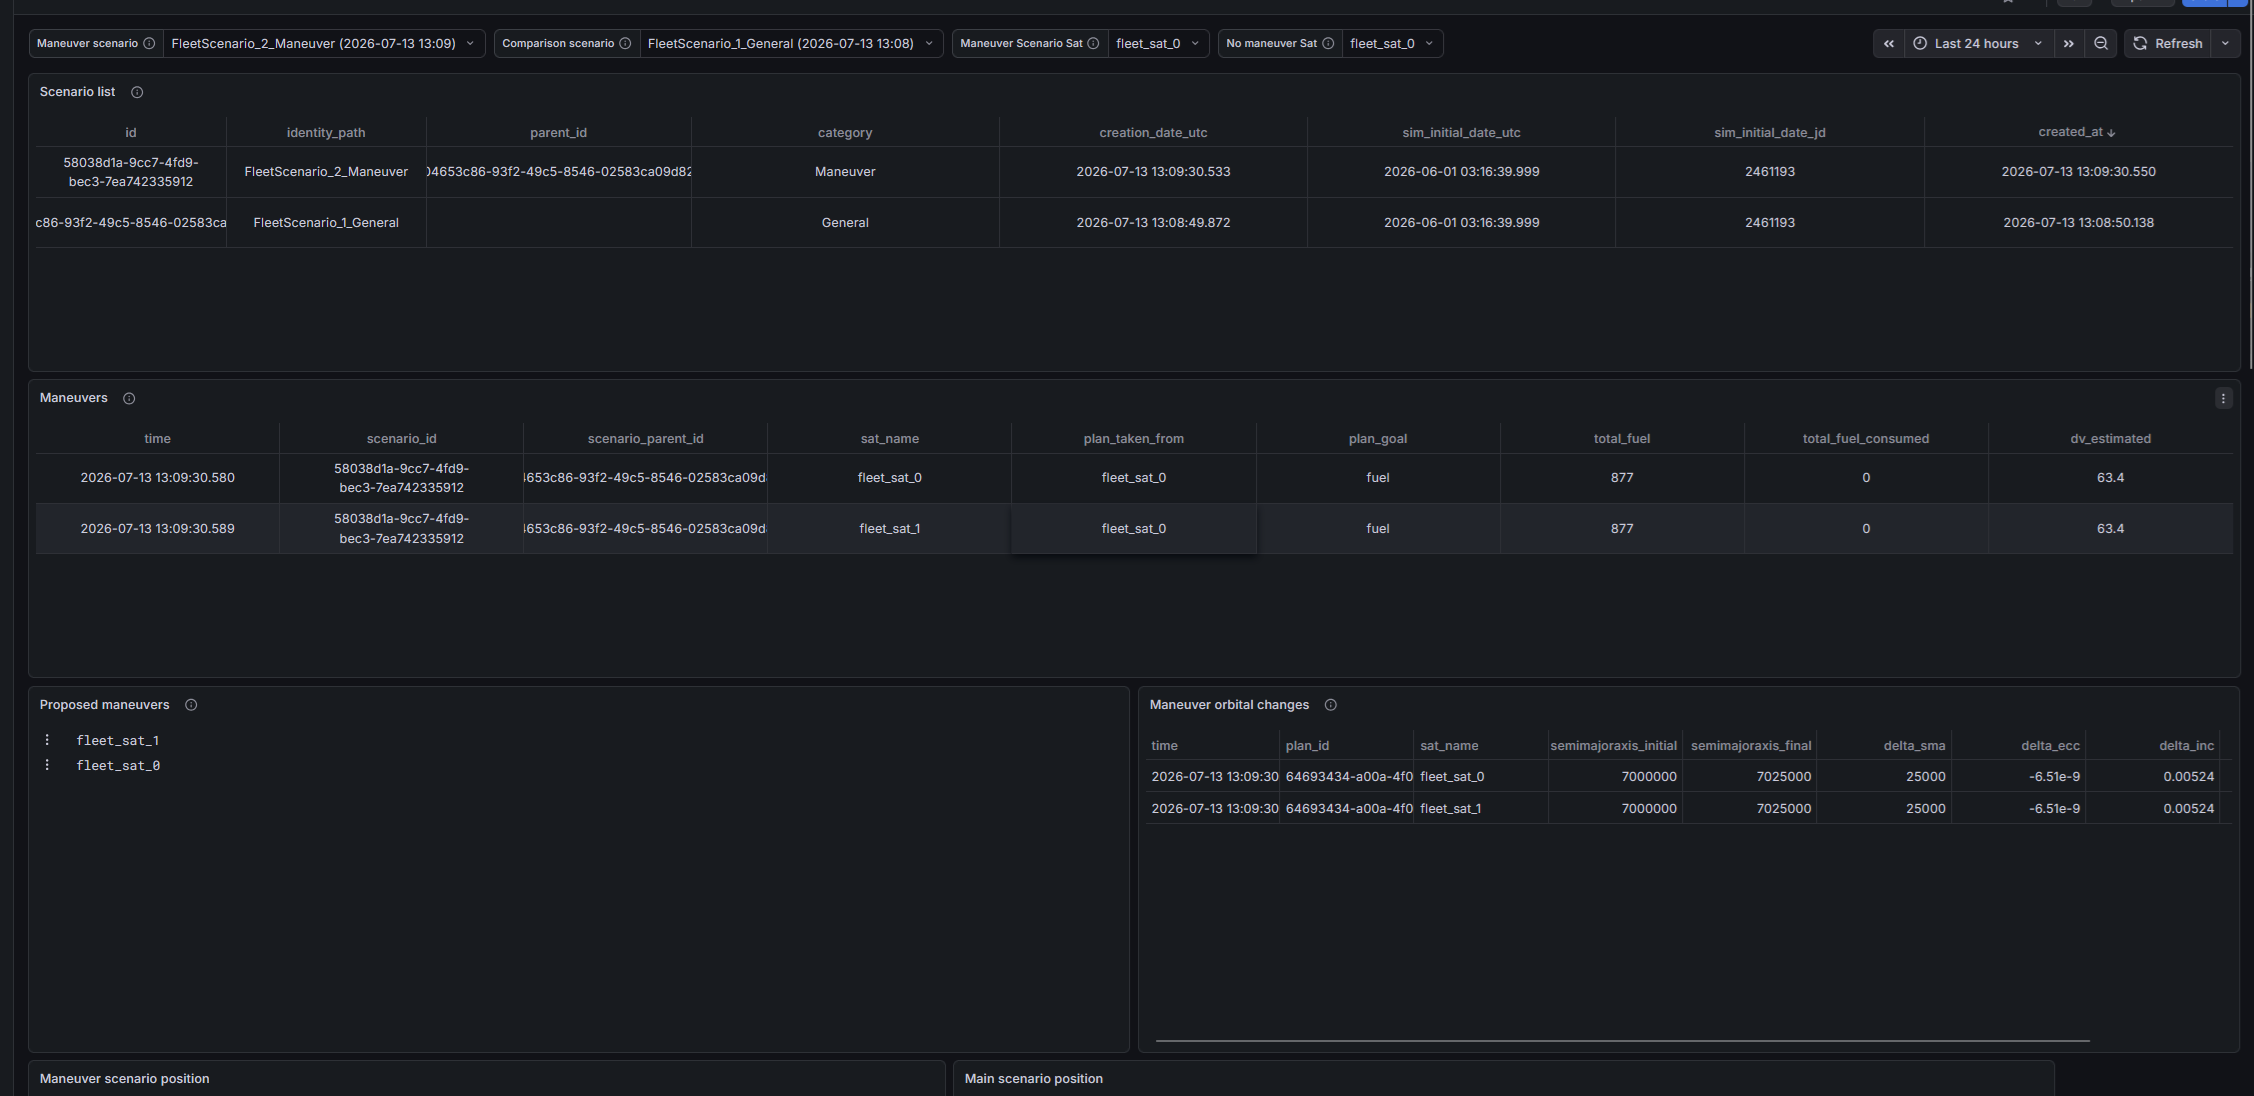
Maneuvers dashboard
Displays the scenarios with attached maneuvers to satellites as well as their parents. Shows the estimated maneuver plans.
Realtime relative measurements
Displays relative metrics between satellite pairs.
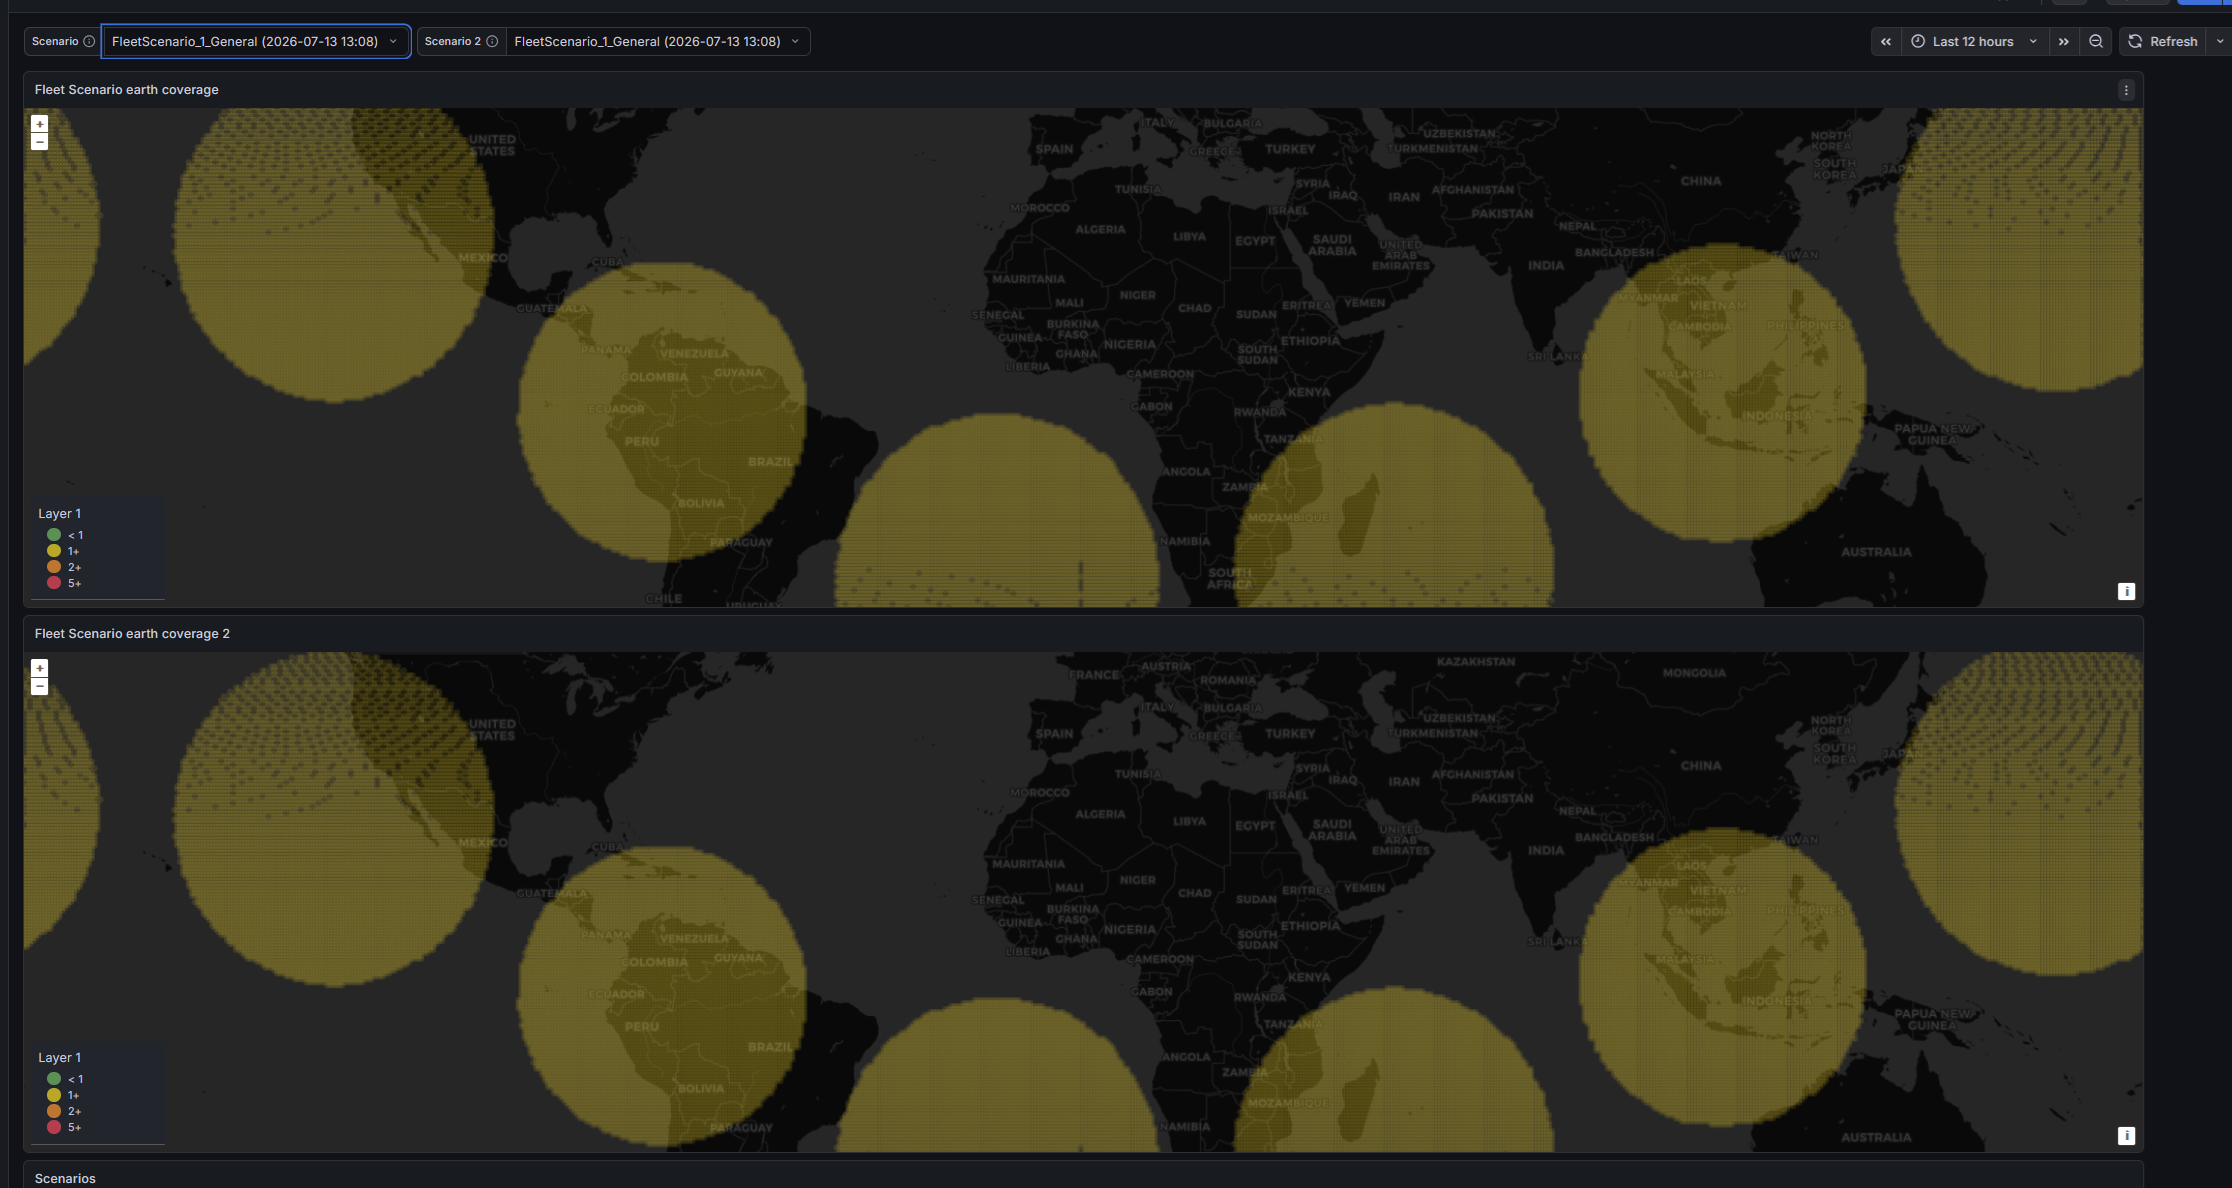
Scenario fleet coverage
Displays the fleet coverage in a specific scenario.
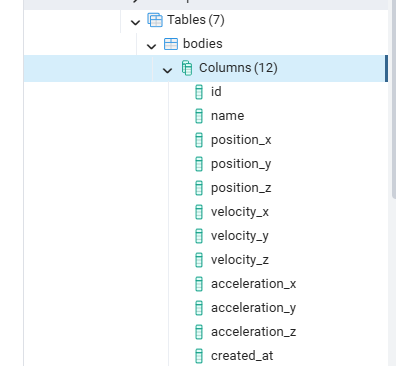
PostgreSQL tables created by MDS
This information can be useful if you want to create your own custom dashboards or queries.
It is recommended to view the database data in a convenient way to make queries. pgadmin4 is used in screenshots below.
For more information on how to create dashboards, visit the official Grafana page:
https://grafana.com/docs/
Each column represents what data is provided in one row at one time step.
fleet_propagated_bodies
What data is exported from MDS Solaris
MDS Solaris generates two primary types of simulation data: realtime data and scenario data.
Realtime data is generated during execution of the main simulation and represents the live state of the simulation as it progresses. In the PostgreSQL database, realtime data tables are identified by the prefix:
realtime_*
Scenario data is generated during offline computations, such as fleet propagation, coverage analysis, and other background calculations. These operations are performed using the Scenario logic, where each offline calculation run creates a separate scenario with a unique scenario ID.
Since multiple scenario calculations can be performed with different configurations, simulation data may overlap between scenarios. To correctly distinguish between datasets, it is recommended to filter PostgreSQL queries using the corresponding scenario ID. Several examples demonstrating this filtering approach are included in the provided Grafana dashboards.
Scenario-based data generation is particularly useful for comparing spacecraft, constellations, or mission configurations under different conditions, parameters, or prediction models.
To generate example data for Grafana visualization, run the following Python example:
example_data_generation_for_grafana.py
This example populates the database with representative simulation data that can be used with the provided Grafana dashboards.
!!! note When visualizing data, always verify the timestamp used by the visualization. The displayed date may not correspond to the original simulation date or the data creation time.
Data Generated
MDS Solaris currently provides the following data outputs:
Spacecraft and Ground Station States
- Satellite and ground station positions.
- Satellite and ground station velocities.
- Satellite accelerations.
Visibility Data
- Ground station to satellite visibility information.
Maneuver Data
- Planned spacecraft maneuvers and associated maneuver information.
Relative Measurements
- Relative position, velocity measurements between satellite pairs.
Satellite Telemetry
General spacecraft telemetry data, including:
- Torque.
- Thrust.
- Attitude state.
- Custom quaternions.
- Angular velocity.
- Angular acceleration.
Coverage and Ground Tracks
- Fleet coverage calculations.
- Satellite ground track information.
Orbital Data
- Kepler orbital elements.
Scenario Data
- Scenario definitions and identifiers are stored in a dedicated table.
- Scenario IDs allow separation and filtering of data generated from different simulation runs.
Collision Data Messages (CDMs)
If Space-Track account credentials are configured in MDS Solaris:
- Collision Data Messages (CDMs) are automatically retrieved.
- CDM data is stored in the PostgreSQL database.